Today I wanted to continue learning about Arthur Smith, new offensive coordinator for the Pittsburgh Steelers. Last time I did a pass-types study and wanted to layer in some quality context next with the Steelers’ pass-game success.
Two great data points I’ll use today courtesy of Sports Info Solutions (SIS) are Adjusted Net Yards Per Pass Attempt (ANY/A = Passing yards – Sack Yards + (20 * Passing TD) – (45 * Interceptions)) / (Passes Attempted + Times Sacked) along with Expected Points Added (EPA = expected points before – expected points after).
Here’s an initial view of the qualifying QBs on all passes (min. of 70 attempts per season):
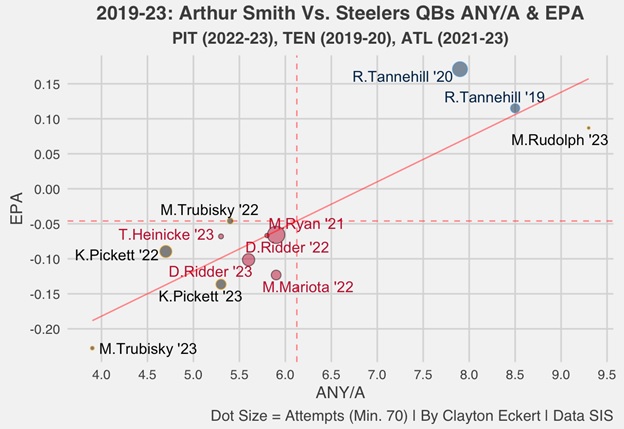
For Smith, the best results came with QB Ryan Tannehill in Tennessee. The latter posted strong numbers in both 2019 (8.5 ANY/A, 0.12 EPA) and 2020 (7.9 ANY/A, 0.17 EPA). The two seasons featured 6,561 passing yards, 55 touchdowns, and just 13 interceptions. Wow. Facilitated Smith’s offense very well in what many would consider his strongest two seasons with their fantastic rushing success certainly an aid.
The only other comparable player was Mason Rudolph for Pittsburgh in 2023, albeit on a much smaller sample size. He had the best 9.3 ANY/A of the group, along with a 0.09 EPA that only ranked behind Tannehill. Rudolph had 719 yards, three touchdowns, and no interceptions. His strong play warranted him keeping the starting job to end the season over Kenny Pickett, who had a far worse 5.3 ANY/A and second lowest EPA of the entire group last season (-0.1).
Pickett’s first two seasons included 4,474 yards, 13 touchdowns, and 13 interceptions. They left much to be desired and highlight the hope that the hiring of Smith can bring results closer to what he had with Tannehill. The only player with lower numbers than Pickett on the chart was Mitch Trubisky, bottoming the results in both ANY/A (3.9) and EPA (-0.23), appropriately opening the door for Rudolph’s opportunity in 2023.
The rest of the visual is staggering, seeing the struggles of all QBs in Atlanta, and the rest of Pittsburgh’s players on the bottom left as well. Matt Ryan had the best balance and most opportunity in 2021, with 5.9 ANY/A and -0.07 EPA on 3,968 yards, 20 TDs, and 12 interceptions. So, there is evidence on Smith’s resume of passing success in Tennessee, but it was consistently below average in Atlanta with largely below-average QB play.
In the previous studies, curl and out routes were the only scheme among the three most commonly run for Tennessee, Atlanta, and Pittsburgh in their respective spans. With this in mind, here are the ANY/A numbers for those pass types:
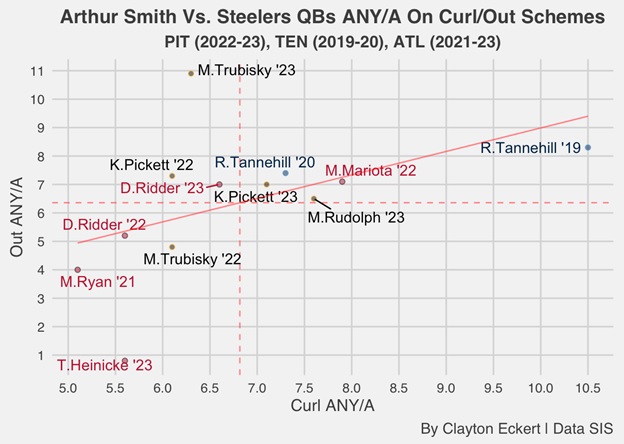
For starters, we see Tannehill remains above the mean on this chart in both seasons with Smith as his OC, particularly in 2019. His 10.5 curl ANY/A is very impressive, especially considering it was the most utilized route (138). Outs were a close second (131) with Tannehill also posting a strong 8.5 ANY/A. He fared well in 2020 too with a 7.3 curl ANY/A and 7.4 on outs when the running game was even better.
To a similar extent, Marcus Mariota benefited from Atlanta’s robust rushing attack with Smith as a play caller with a respectable 7.9 ANY/A on curls and a 7.1 out ANY/A. Each were well above his 5.9 overall ANY/A. Pickett’s 2023 results also land above the mean, with a 7.1 ANY/A on curls (47 attempts) and 7.0 out ANY/A (44 attempts), also better than his overall 5.3 ANY/A.
The final player with above-average results on the chart was Rudolph last season, faring better on curls (7.6 ANY/A, eight attempts) compared to a 6.5 out ANY/A (11 attempts). He interestingly had a stronger 9.3 overall ANY/A.
Outside the top right, the best individual ANY/A came from Trubisky in 2023, with a strong 10.9 on just seven out-route attempts, compared to 6.3 on curls with notably more attempts (31). So, on the two most commonly run schemes for all three teams in our sights, the highlights for Smith were in Tennessee and in 2022 with Atlanta, which each featured quality rushing attacks. That reinforces the interest in the hiring and the hope of what’s in store for the Black and Gold in 2024.
Let’s dive deeper, seeing how the teams fared each season, conditionally formatting their ANY/A by pass types. I’ve included routes that were among the 10 most commonly utilized for each squad and sorted them by the most total attempts:

Curl was most successful for Smith, particularly in both seasons with Tennessee and Atlanta’s 2022 season, each eclipsing a 7.0 ANY/A. The same is true for the Titans on outs with Pittsburgh encouragingly on par with them (7.4 ANY/A). The worst numbers came from the 2021 Falcons, (4.5 curl ANY/A, 2.9 out EPA). Yikes.
As expected, Pittsburgh lands toward the bottom of the screen results with a 4.6 ANY/A in 2022 and the worst 4.1 ANY/A on the pass type last season. The 2019 Titans led with an 8.9 screen ANY/A while the best result in Atlanta was 7.7 last season, which was better than Pittsburgh the last three years. Hopefully these results point to much-needed screen improvements for the Steelers in 2024.
Slant results are very telling. Smith’s best results aligned with his stronger rushing units, encouragingly. The same is true for Pittsburgh’s substantial improvement from the worst 4.5 ANY/A on the table to an 8.9 slant ANY/A in 2023. The data points to a hopeful continuation of this with Smith in Pittsburgh with the hope for more consistency on the ground in turn aiding that goal through the air as well.
Tennessee had the best flat numbers with Smith’s results tailing off in Atlanta and a particularly low 1.8 ANY/A in 2022. Pittsburgh was in the five range (5.7, 5.3), using the route most of the group, its third most common the last two seasons. The Titans also were tops on dig schemes with stellar numbers (12.7, 12.3). Pittsburgh also had a nice 10.4 last year followed by the Falcons in 2022 (9.1). The 2023 season was a different story for Atlanta with an abysmal -3.1 ANY/A in 2023.
The 2021-22 Falcons and 2022 Steelers fared best on broken plays, each in the mid-sixes and within a 10th of a point from each other. A rare sighting where Tennessee was worst in both seasons (0.4, -0.7). The most successful unit on drags was Atlanta in 2022 at 11.2 followed by the 2020 Titans (9.2) and ’23 Falcons (8.5). Pittsburgh posted 5.8 and 5.7 drag ANY/A numbers the last two years, besting only the 2019 Titans (4.6).
A big takeaway is Smith’s universally stronger deep cross ANY/A the last five seasons. Tennessee had an absurd 18.5 ANY/A in 2019 with his lowest result coming the following season (6.9). Expectedly, Pittsburgh was far worse, particularly with a 3.3 ANY/A in 2022, improving last season but not enough (4.2). Very optimistic we see that quality and more attempts that we’ve seen in his previous stops in 2024.
The remaining concepts came in at 100 attempts from all units combined. Largely, the 2019 Titans fared best, with the strongest results in go/fly (17.8), seam (23.3), and check and release (6.7). In 2020 they had strong results on corner, seam, and fade and back-shoulder throws but didn’t lead the pack.
The top swing team was Atlanta in 2022 (10.0 ANY/A) while Pittsburgh was in the basement in comparison (2.9). The Falcons also led on comebacks in 2022 (11.3) and fade/back shoulder last season (14.8). Less utilized concepts, but the Steelers would surely welcome that success, particularly running the latter often in comparison.
The only pass type the Steelers led the pack in was corner in the 2023 season. Just 12 attempts though, and along with other results, emphasizes the vast need for Smith to bring some encouraging prior results with him in both the run and pass game. Knock on wood this occurs, bringing playoff success that Pittsburgh has been way too long removed from.