Today, I wanted to provide the other side of the coin to my Steelers Quarterback Passing Locations, looking at and providing takeaways on Pittsburgh’s receiving data for the regular season thus far. Here is the last receivers article I did following week eight, which will be referenced in this article with the goal of seeing how things have progressed through the season, and some takeaways of how things have looked since trading wide receiver Chase Claypool. Thanks to Thomas Mock for his great article that helped me learn much of what I’m using today. Couple notes before we jump in. All yardage referenced are air yards from the line of scrimmage. Bats at the line of scrimmage, spikes, and clear throwaways are removed.
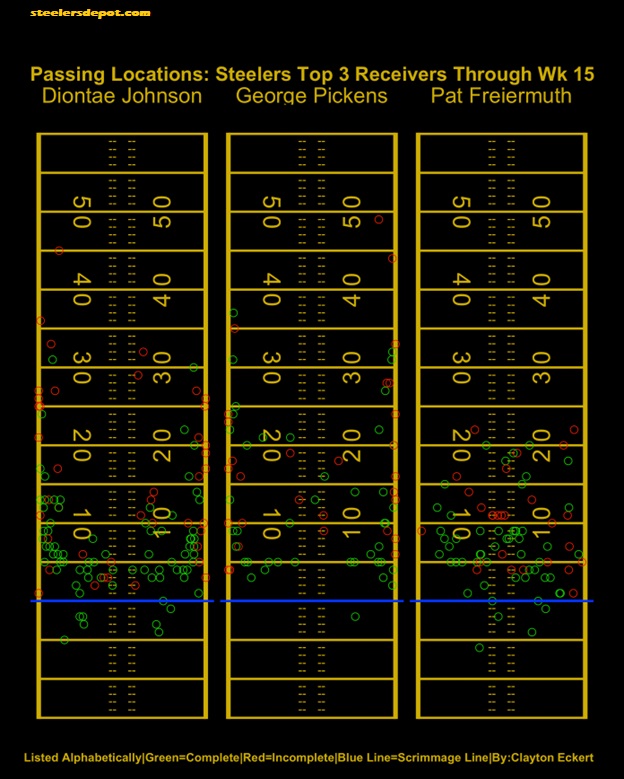
Pittsburgh has mainly stuck to three primary receivers this season, so let’s start with their dots:
Wide receiver Diontae Johnson leads the team with 118 charted targets (with five removed) and 77 catches for a 65.3% catch rate, which has encouragingly improved from 60.6 through week eight and ranks second of this group. A couple things jump out right away, starting with no catches inside the hashes, which is crazy considering his high number of total targets that ranks seventh in the NFL. A trend we’ve seen all season is mostly out and stop/comeback routes, though there has been a bit more variety such as slants and in routes sprinkled in since the bye week. Johnson is 34/43 at five yards or less (79.1%) which tops the group, and five of his nine incompletions at or between the numbers including an interception going off his hands, and the other four incompletions near the sidelines. He is now 31/40 from the 5-10 yard range (77.5%) ranking second among the top receivers, with 29 of these passes (72.5%) clearly outside the numbers. In the intermediate range, Johnson is 16/30 (53.3%) which is the best rate of the group but includes two interceptions from Pickett and has improved from 47.6% since the bye. These targets have largely been outside the numbers with the right sideline being a particular struggle at 15-20 yards (2/6, 33.3%). He has been targeted a bit more from the right hash to the numbers in the 10-15 yard range, but only 3/7 (42.9) on those opportunities. Strictly outside the numbers from 15-25 yards, and a poor 5/21 (23.8) on explosive catches overall including two interceptions from each quarterback, which is by far the worst on the team, though improved from an abysmal 15.4% since week eight. Only two explosives between the numbers that were both incomplete as well.
Tight end Pat Freiermuth is second on the team with 80 charted targets (two removed) and 53 catches for a 66.3% catch rate which bests the top three receivers, down slightly from his 68.1 through week eight. As many would expect, he has been targeted over the middle far more than any player this season, accounting for 63.8% of his targets. This highlights more outside-the-numbers targets following the bye week, with his previous average coming in at a much higher 76.6%. At five yards or less, Freiermuth is 22/30 (73.3%) which ranks third in this group including an interception off his hands from Pickett, and has rarely been targeted on the left side in this range. He is 26/33 (78.8%) from 5-10 yards, which bests the top receivers including both of his touchdowns on the season, and a recent over-the-middle interception, all coming from Trubisky. He has been money between the numbers in this range overall, with only one other incompletion (13/15, 86.7%). Now for the intermediate range, where Freiermuth’s numbers rank third of the group at 11/25 (44%) including two interceptions from each quarterback, and down from 52.9% through week eight. The 10-15 yard range over the middle has been particularly poor, only 1/8 (12.5%) including the just mentioned picks. Freiermuth has been the best on the team by far at the 15-20 range 8/12 (66.7%), largely over the middle (6/9 for the same percentage). While his overall depth of target has encouragingly increased compared to last season, only five explosive opportunities in 2022 with the longest at 22 yards. He is 2/5 in this range (40%) which ranks second, and important to note each miss coming after the bye week from Pickett.
Wide receiver George Pickens is third on the team with 71 charted targets (two removed) and 42 catches for a 59.2% catch rate which ranks third of this group and has improved slightly since week eight. Important context to this rate is his highest percentage of explosive targets as most would expect, accounting for 31% of his charted targets on mostly go balls. He is 11/21 on or outside the numbers in this range (52.4%) including a touchdown from Pickett, and only one opportunity between the numbers that was caught for a total explosive catch rate of 54.5%, which is by far the best of the top receivers. In the intermediate range, Pickens is 11/24 (45.8%) which is second on the team including his other touchdown also from Pickett, but a big drop from a 57.1% catch rate at the bye. He currently has a 50% catch rate over the middle (4/8) which I hope to see increase in the future, and is 7/16 outside the numbers (43.8%). Between the numbers overall, he is also 50% on his ten opportunities. Only one target between the hashes that was caught in the intermediate range, and hope to see more of that to close the season as well. The 15-20 yard range has particularly been poor at 2/9 (22.2%), the lowest mark of the top receivers. From 5-10 yards, Pickens is now 17/24 (70.8%) which is third of the group, with most of the incompletions coming outside the numbers, where he is 11/17 (64.7%). Pickens has an incredibly good completion rate at five yards or less (15/17) for an 88.2% completion rate that tops the group, with his two incompletions coming on the left side. This was something I expected from the last article, with him taking a larger role in the short game following the trade, and more context to his improved overall catch percentage.
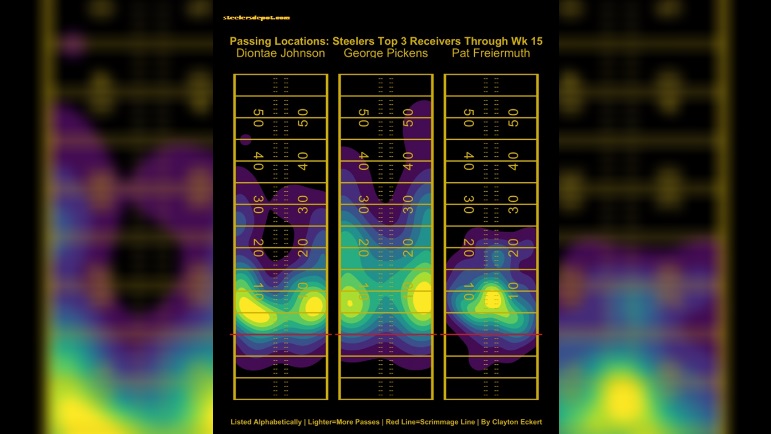
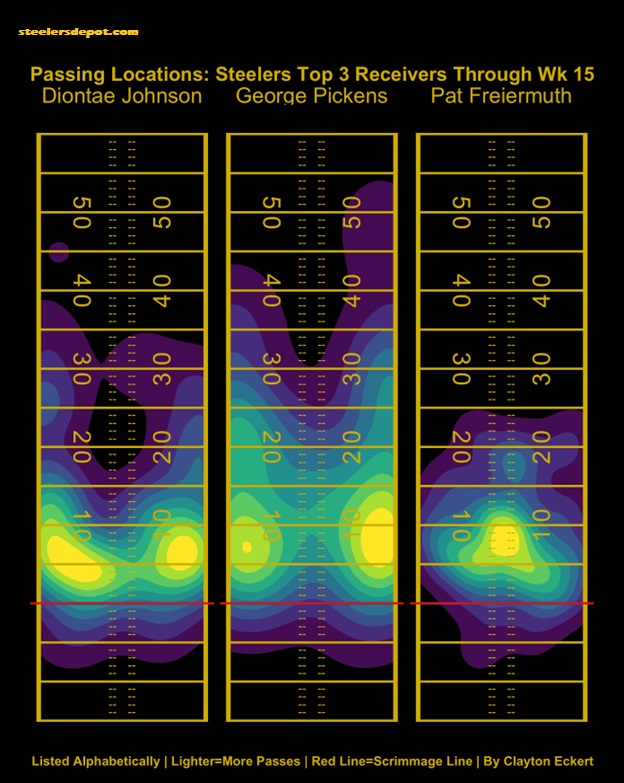
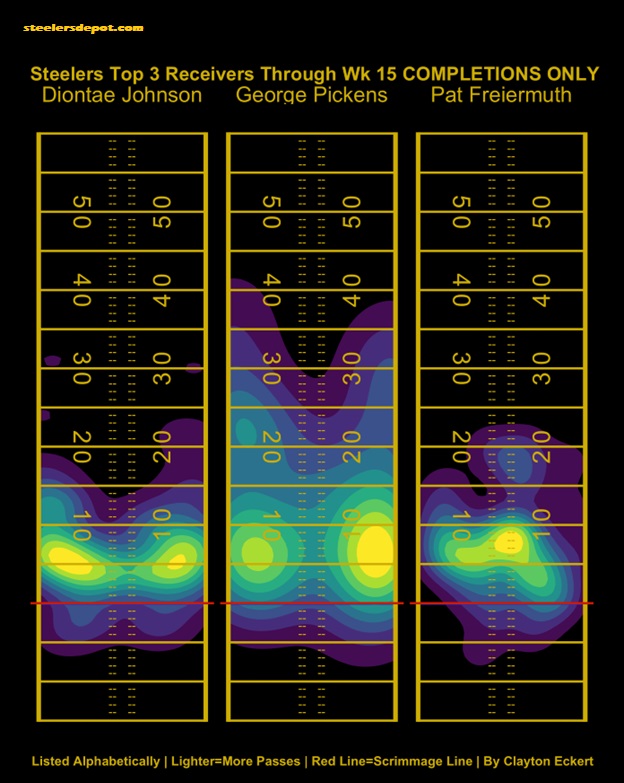
Here are the heat maps of all targets, then completions only through to date for more visual context:
Johnson’s target chart looks similar in many ways to my last article, starting with a most targeted area on the left from three to eight yards. He has seen more opportunity since the bye to the right side from four-eight yards outside the numbers for his other highly targeted area to date. We see a bit more depth of target as well, but the biggest trend that has remained is the black hole in the intermediate/explosive range over the middle. The completions-only graph highlights the lack of downfield connection overall, giving important context to his highest catch rate of this group in the intermediate range and where those catches have come, along with the big drop-off in the explosive range.
Pickens encouragingly has the widest target chart by far, and his most common area remaining virtually the same since week eight, to the right outside the numbers from four to 13 yards. The two biggest changes are an increased depth of target to the left and over the middle. On the completions-only chart, he impressively maintains his healthy heat map in most areas, with his two double explosive incompletions to the right sideline being the exception.
Freiermuth has seen quite a bit of change in his maps, with his most targeted area now at six to ten yards between the hashes, compared to the right hash to the numbers from two to six yards previously. He has also seen an increase of targets and completions in the 15-20 yard range with particular success over the middle to the right numbers, and increased depth outside the left numbers as well.
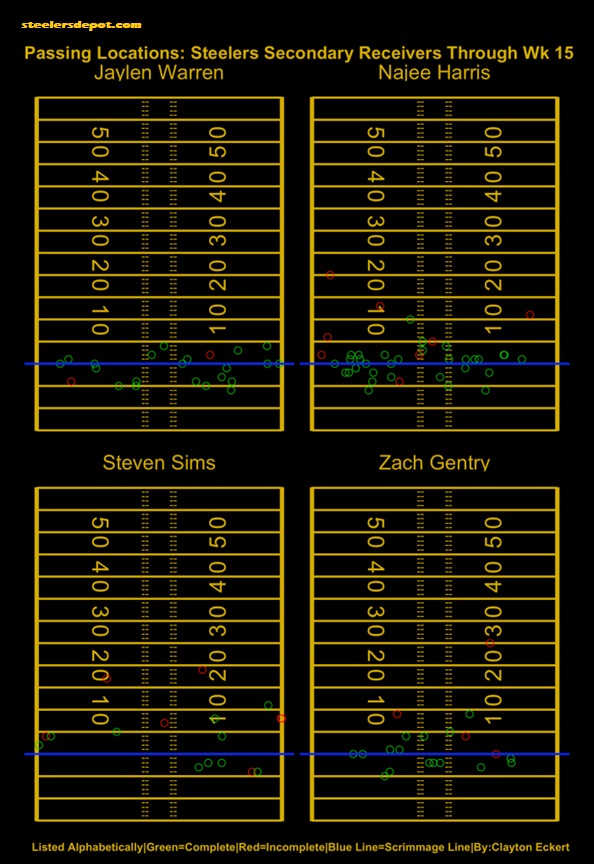
Next, I wanted to look at and provide the same data for the secondary receivers. Let’s start with the dots for the remaining receivers with double-digit targets:
Right away we get a sense of the lack of production overall from complimentary players, relying of the top three receivers to manage much of the workload since the bye week and Claypool trade, whose 50 targets while on the Steelers would slot in fourth on the team. The running backs are the next most targeted, with running back Najee Harris ranking fourth at 40 (none removed) and 32 catches for an 80% catch rate, and has largely been utilized at five yards or less which is expected from the position. 87.5% of his opportunities have come in this range, and is 31/35 for an 88.6% completion rate, with three of his four incompletions coming between the numbers. Harris is 2/4 (50%) from five to ten yards, going 2/3 between the numbers. 1/4 in the intermediate range with the one completion coming between the numbers, and one explosive 20-yard attempt that was incomplete for a 25% completion rate at ten yards or more.
Running back Jaylen Warren is fifth on the team with 23 charted targets (one removed), with 21 catches for a strong 91.3% catch rate. As we can see from the visual, his longest opportunity this season has been at four yards on two occasions, each going for completions. He has been very good in the YAC department, something we have seen more of and hopefully continues to end the season. Tight end Zach Gentry is up next with 21 charted targets (none removed) with 17 catches and an 81% catch rate. His opportunities have largely come at less than ten yards on or between the numbers, going 12/15 (80%). One explosive incompletion at 25 yards, which is interestingly longer than any target to Freiermuth this season, something I’d like to see change in the final three games of the season.
Wide receiver Steven Sims was a candidate to see more time at the vacated slot position, and has 14 charted opportunities since the trade, which comes out to 2.3 per game. In totality, he has 17 charted targets (with one removed) and ten catches for a 58.8% catch rate. Most of his plays have gone to the right side, where he is 7/10 (70%). One opportunity in between the hashes that was incomplete in the 5-10 yard range, and 3/5 outside the left hash (60%). In terms of pass distances, Sims has mostly been targeted at five yards or less (76.5% of the time) and is 9/13 (69.2%) which is lower rate than the top three receivers and including five screens, all to the right side. At 5-10 yards, he is 2/4 (50%) with three of those coming on or between the numbers. 1/3 in the intermediate range (33.3%) with the completion going outside the numbers to the right, while the two incompletions came on or near the numbers. No explosive opportunities to date, and it will be interesting to see what the final data looks like following the season. The data really highlights what we’ve been saying here at Steelers Depot, the team really needs to upgrade the slot receiver position next season. Hopefully wide receiver Calvin Austin, who was drafted this year but missed due to injury can provide something, but would be wise not to assume that.
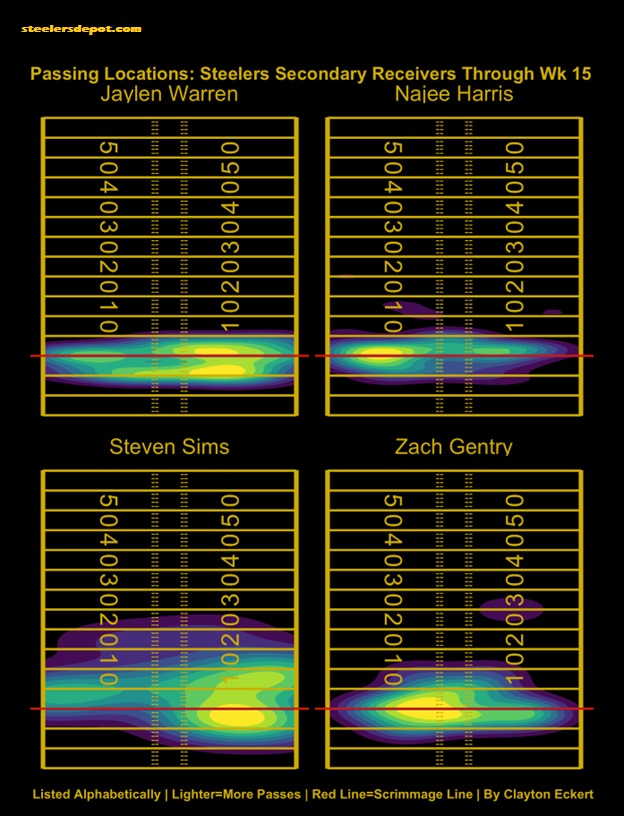
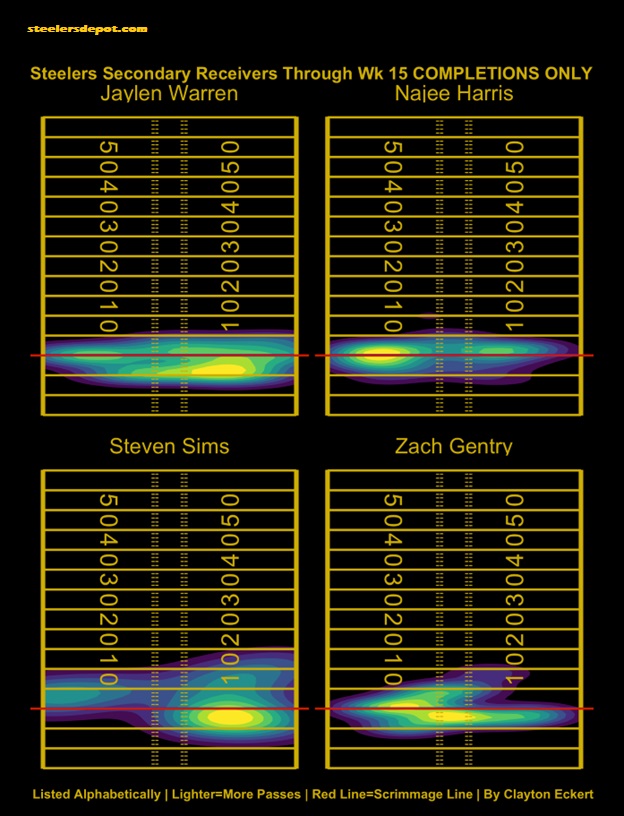
Now for their heat maps of charted throws and completions only:
The heat maps really help illustrate the earlier point, Pittsburgh not relying too much on this group and in particular Sims. Looking at his target chart might give a slight hint of optimism, but comparing it to the completions-only view really highlights how close to the line the whole group has been utilized this season. Sims’ most targeted and completed area has been to the right behind the line of scrimmage on his screen opportunities, and his longest completion coming at 11 yards, which is the only completion of this group of more than ten yards! Warren’s most common area is similar, but extend further in toward the right hash. Harris has gotten most of his opportunity from the left numbers and slightly out and near the line of scrimmage with a clear dropoff on his deeper targets, and his longest catch coming at ten yards. Gentry’s most targeted area is from the middle to left numbers from -3 to four yards, with the middle of the field showing up stronger in the completions view, which points out his three flip pass opportunities, and his longest catch coming at nine yards.
What are your thoughts on the receiver data? What about how the roles and success (or lack thereof) have progressed since the Claypool trade? Thanks for reading and let me know your thoughts in the comments!

