With the Week 2 game in the books, it’s time to provide my quarterback passing locations charting for the game and the regular season thus far. In case you missed the week one article, I will be charting, visualizing, and providing takeaways for the all-important quarterback position for the Pittsburgh Steelers. Thanks to Thomas Mock for his great article that helped me learn much of what I’m using today. Couple notes before we jump in. All yardage referenced are air yards from the line of scrimmage and bats at the line of scrimmage, spikes, and clear throwaways removed. Quarterback Mitch Trubisky went 21/33 on the stat sheet with one touchdown and an interception. One of these passes was removed for the sake of this charting: a throwaway out of bounds.
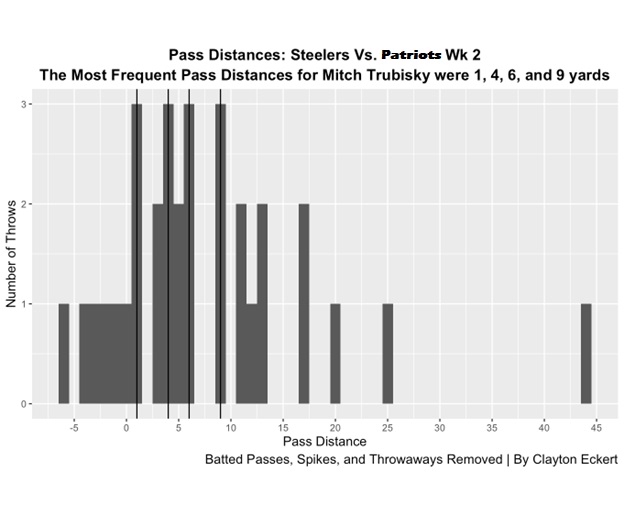
Let’s start with a simple view of the 32 passes with number of throws and pass distances for week two:
34.4% of passes were between 0-5 yards, the most common pass distance for the week and a typical regular season. This is down from 41.1% in week one, with the biggest uptick in week two coming in the 5-10 yard range at 25%. This included the one touchdown to tight end Pat Freiermuth on a nice route and throw to the end zone. Unfortunately, this also included the interception, with the ill-advised pass being tipped in the air. 15.6% of passes were behind the line of scrimmage (up from 11.8% in the opener), which was tied for the third most common distance with 10-15 yard passes. 9.3% were 15-20 yard passes, with the same percentage being explosive air yards (20+) for the least common areas. So, a bit more yardage on short targets, but important context here that attempts of 15+ yards were virtually cut in half compared to the opener. It will be interesting to see what this looks like following the Browns game on Thursday night.
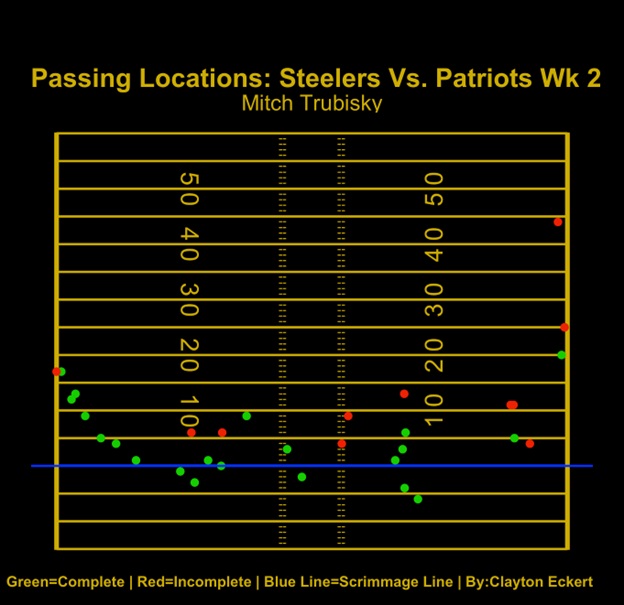
Here are the dots of completions and incompletions for week two:
Here we get great visual context to the earlier point, along with adding more with the lack of passes in the middle of the field. This was even more scarce than week one, especially with only one attempt between the numbers at ten or more yards down the field, an incompletion at that. Also, the deep shots that were taken were all along the right sideline, going only 1/3 on explosive air yard passes. All three of these attempts came when trying for the end zone just before halftime. While we understand Trubisky has to make the correct read dependent on what the defensive coverage is, there were downfield opportunities missed that I highlighted in my week 2 recap, along with similar observations from many on the Steelers Depot team. Here’s to hoping this can improve to provide an explosive spark the offense and Steelers desperately need, as well as taking the opportunities when they are there throughout the game.
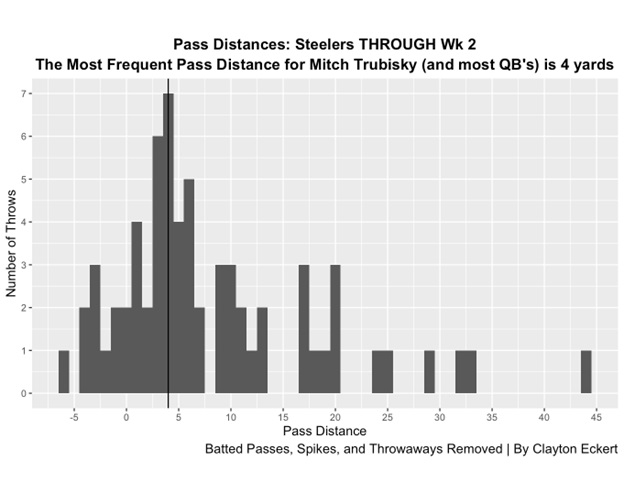
Now let’s look at the total number of throws and pass distances for the 66 charted throws throughout the regular season:
37.8% of passes have been in the 0-5 yard range first two games. The second highest pass distance of 5-10 yards has happened on 25.8% of passes thus far. 13.6% have been 20 yards or more, putting a number on the earlier point of more deep targets in the opener. 13.6% of passes have also been behind the line of scrimmage with an uptick last week as mentioned earlier. 12.1% have been from 10-15 yards, with the same percentage also coming at 15-20 yards. This highlights not only the explosive passing game has been lacking, but also in the intermediate range which is not the common narrative going around.
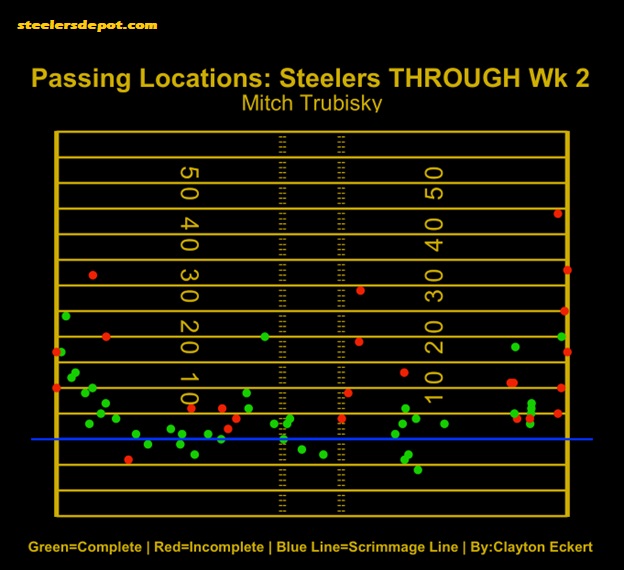
Next, let’s look at the dots for the quarterbacks through two regular season games:
Even though this is a small sample size, we see great context to trends and takeaways to what has transpired so far this season. One that jumps out are where his incompletions have come. Only 1/8 on the right sideline at various pass distances, along with 0/4 on or just outside the right hash. Trubisky has been successful on out routes, especially to his left as well as a higher completion and throw rate on that side in general. It’s also interesting to look at the throws on or just inside the numbers, with a perfect completion percentage at ten yards or less to the right compared to four incompletions to the left.
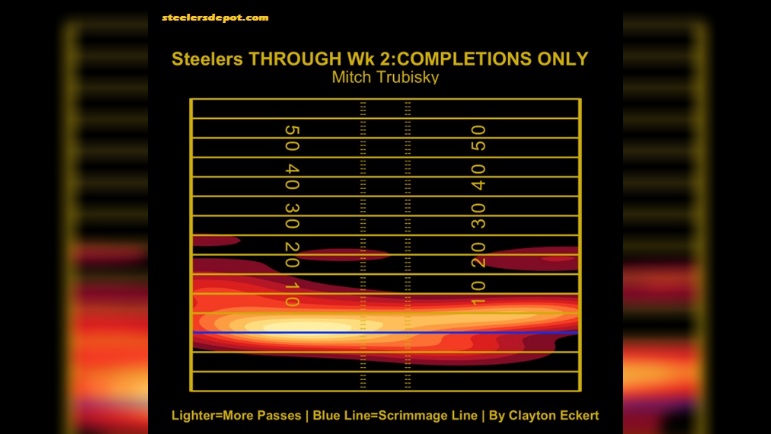
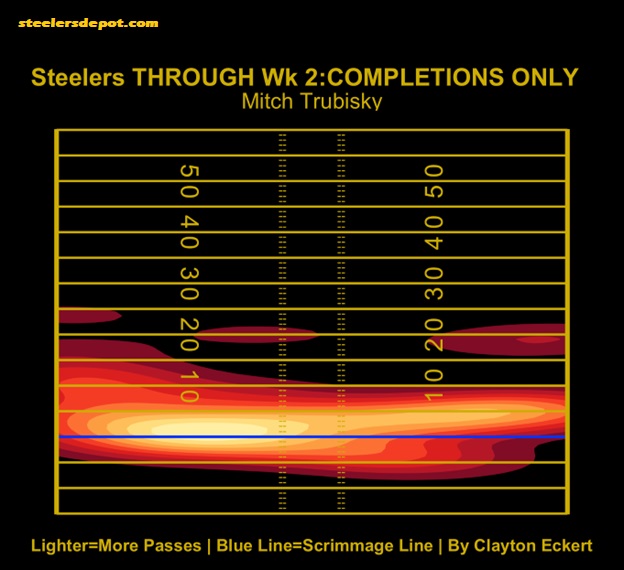
To close, here is a heat map viewing completions only for the first two games:
Here we see an even more dense chart at less than five yards than last week, along with an increase in targets to the left. This side of the field was a trend I pointed out in my preseason charting. The left intermediate is a stronger area of converting passes for Trubisky as well, and crazy to see the completely (pun intended) empty areas from 10-20 yards over the middle, along with 10-15 yards on the right side. Only three of the 42 completions were 20+ air yards, and while it obviously won’t be the most common pass distance, hope to see more moving forward with only three attempts last game compared to six in the opener.
What are your thoughts on the charting and how Trubisky fared in week two? How about the season thus far? Thanks for reading and let me know your thoughts in the comments.

