With Week 1 now in the books, it’s time to provide my first quarterback charting of the regular season. In case you missed the preseason articles, I will be charting, visualizing, and providing takeaways for the all-important quarterback position for the Pittsburgh Steelers. Thanks to Thomas Mock for his great article that helped me learn much of what I’m using today. Couple notes before we jump in. All yardage referenced are air yards from the line of scrimmage and bats at the line of scrimmage, spikes, and clear throwaways removed. Quarterback Mitch Trubisky went 21/38 on the stat sheet, and four of those passes were removed for the sake of this charting: one spike, one bat, and two throwaways.
Let’s start with a simple view of the 34 passes with number of throws and pass distances for week one:
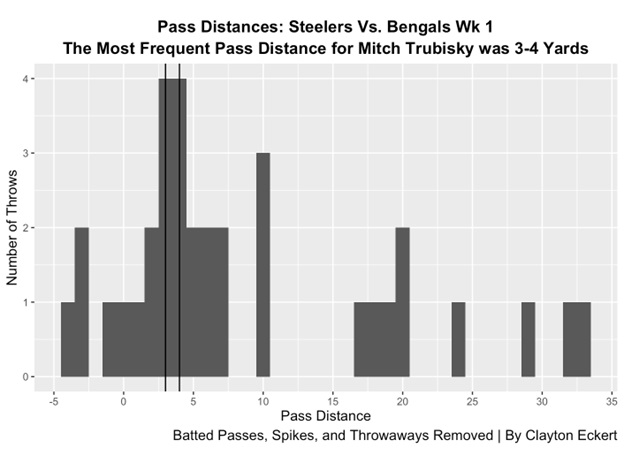
41.1% of passes were 0-5 yards, which is the most common pass distance in a typical regular season. 5-10 passes were the second highest at 26.5%. 17.6% of passes were encouragingly explosive in air yards (20 yards or more), the third highest rate and an uptick with Trubisky taking every snap compared to 14.2% throughout the preseason. The highlight was an insane catch from wide receiver Diontae Johnson, a full extension one handed grab along with crazy awareness to get both feet in as he was being pushed out. The free play to tight end Pat Freiermuth was also impressive, a great find eluding pressure and throw on the run. 14.7% of passes were 15-20 yards, including the flea flicker to get Freiermuth open along with great yards after catch for the explosive 31-yard gain. 11.8% of passes were behind the line of scrimmage, including the one touchdown to running back Najee Harris. Another quality play at this pass distance was the screen to tight end Zach Gentry, with -3 air yards but an explosive 32-yard gain. 8.8% of passes were 10-15 yards, the least frequent pass distance but higher in comparison to the preseason when quarterbacks Kenny Pickett and Mason Rudolph played (only 3.8%).
Here are the dots of completions and incompletions for week one:
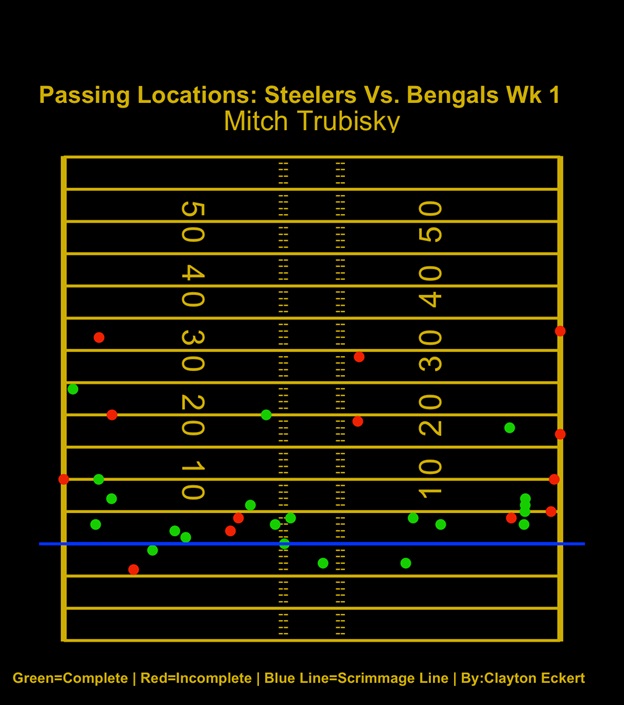
Here we get more context to the pass distances, with locations on the field and where passes were complete or incomplete. First off, we see a good variety of targets to the left and right, compared to the preseason charting showing him heavily favoring the left side of the field. The visual really highlights the earlier point, with the majority of passes at ten yards or less. Looking at 20 yards or more, Trubisky went 2/6, with the incompletions coming near the sidelines and just outside the right hash.
Now for the heat map view:
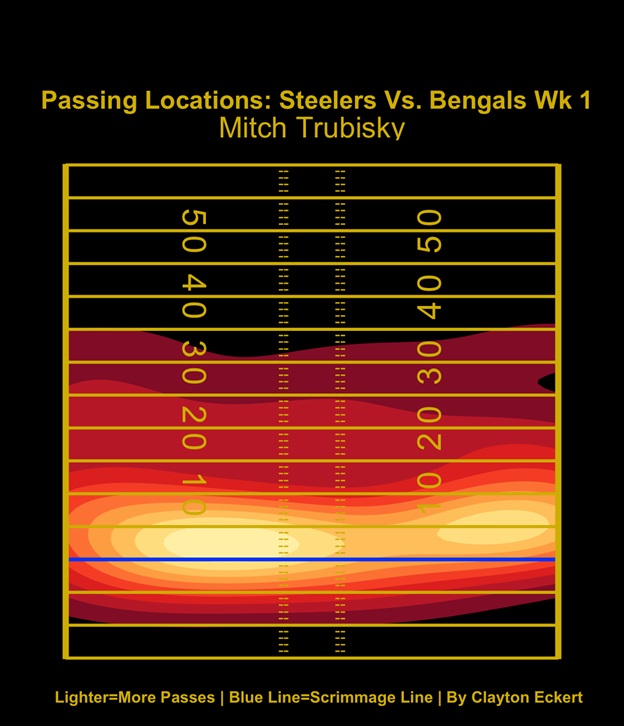
This visual will get more valuable the larger the sample size gets. The areas Trubisky targeted the most so far have been between the left numbers and hash 0-5 yards, and to the right outside the numbers 3-8 yards with four completions having nearly identical x-axes. It is great to see the map extend to all areas of the field, but unfortunately the dot view showed us most of those passes were incomplete.
To illustrate this further, here is a heat map of completions only to close:
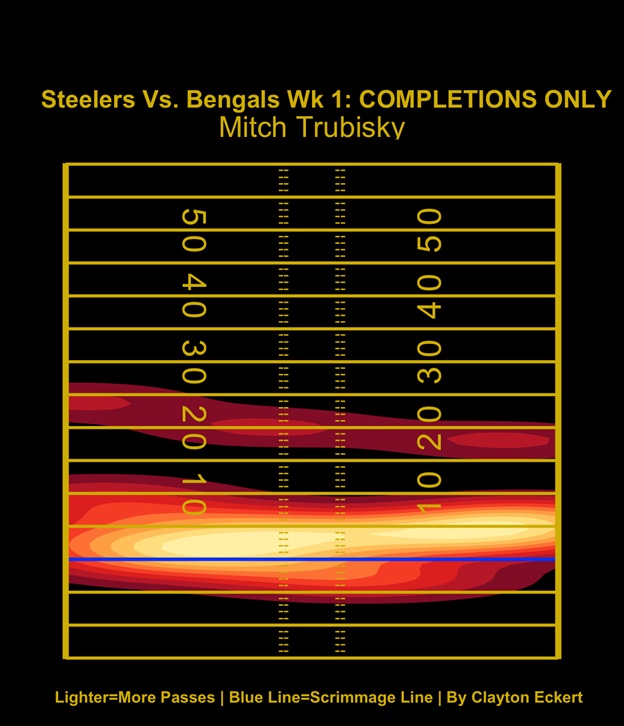
Of course this is a small sample size, but drastic difference to say the least. We really see a big portion of the colors disappear downfield with only 3/9 passes completed 15 or more yards. This will no doubt need to improve with how the 2022 roster is constructed, and you know I’ll be here to track it moving forward.
What are your thoughts on the charting and how Trubisky fared in week one? Thanks for reading and let me know your thoughts in the comments.