The preseason is now in the books, and in case you missed the Week 1 or Week 2 articles, I will be charting, visualizing, and providing takeaways for the all-important quarterback position for the Pittsburgh Steelers. Thanks to Thomas Mock for his great article that helped me learn much of what I’m using today. Couple notes before we jump in. All yardage referenced are air yards from the line of scrimmage and some circumstantial passes may be removed.
Let’s start with a simple overview of the position as a whole with number of throws by pass distances for week three:
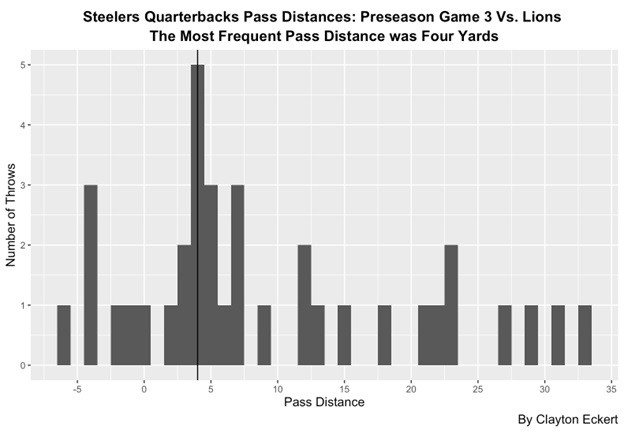
33.3% of passes were 0-5 yards, the lowest percentage of the preseason, especially compared game two (47.1%) when Mason Rudolph got the most playing time. This is where Mitch Trubisky completed most of his passes this week with more playing time. 22.2% were 5-10 yards, which trended downward following the opener (Game One: 41.7%, Game Two: 17.6%). 22.2% of passes in the finale had explosive air yards, an encouraging uptick (the Trubisky effect) compared to 11.1% in week one and only eight percent in week two. 16.7% were behind the line of scrimmage, and gradually saw this increase each game, especially seeing more screen action since the second game where 14.7% were in this range. 10-15 yards was targeted at 11.1%, with Kenny Pickett having the most passes in this range. The least frequent pass distance was 15-20 yards, with Pickett having the only two passes at the distance in week three but both were incomplete.
Here are each quarterback’s throws for week three:

Here we get more context to the pass distances, with locations on the field and where passes were complete or incomplete. Pickett had another good showing, going 10/14 in the third and early fourth quarter, with more air yards than his previous outings. Interestingly, all of his incompletions came at 10 air yards or more in this game and throughout the preseason, not a condemning observation but notable.
Rudolph got very little opportunity on one drive in the fourth quarter going 0/3, with each pass traveling five or more air yards. Trubisky played well going 15/19 and appears to be in command to start week one of the regular season, with an encouraging dot chart especially in pass distances along with a range of areas of the field, but noticeably favoring the left side overall. He had the only touchdown pass of the game for Pittsburgh, to the left at the games most common pass distance of four yards, and an area of the field he targeted the most.
In general, a couple more passes in the middle of the field (on or inside the hashes) with Trubisky completing a nice one of the explosive variety, a beautiful back shoulder throw and catch by tight end Pat Freiermuth I’m sure we can all get used to. He was also 3/5 on explosive attempts, compared to 1/3 by the other quarterbacks, with Pickett having the completion that was also a nice back shoulder throw and catch by wide receiver Miles Boykin.
Now let’s look at the total number of throws and pass distances for the 106 charted throws throughout the preseason:
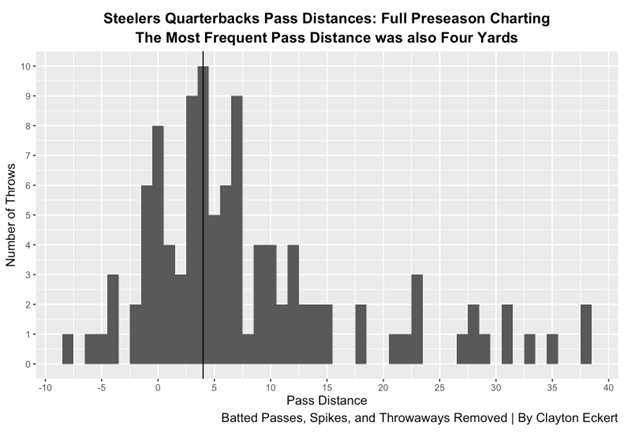
As expected, the most common pass distance was 0-5 yards at 36.8%. 27.4% of throws were 5-10 yards, the second highest pass distance. 15.1% of passes went 10-15 yards, and encouragingly 14.2% of passes were explosive air yards of 20+. 13.2% were behind the line, with Trubisky and Pickett favoring the left side. The least common pass distance was 15-20 yards, at only 3.8% which will be interesting to monitor in the regular season.
Next, let’s look at the dots and a heat maps for the quarterbacks throughout the preseason:
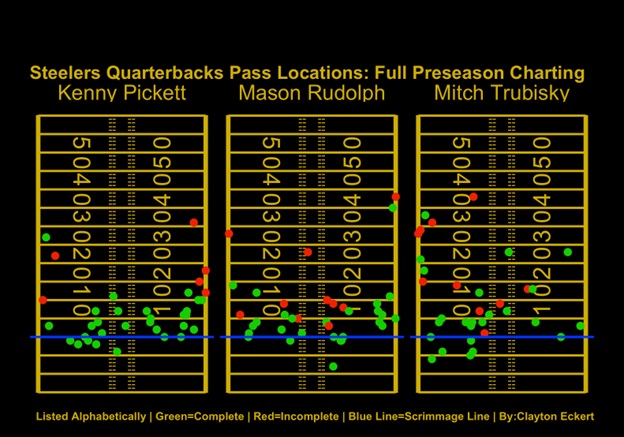
Here we get a good visual of my earlier point on Pickett, with all of his charted throws of less than ten yards being completed and his six incompletions being at ten yards or more. Main takeaway from Rudolph is 7/10 of his incompletions were inside the numbers. The visual highlights Trubisky favoring the left as I stated earlier and completing 50% of his explosive air yard passes.
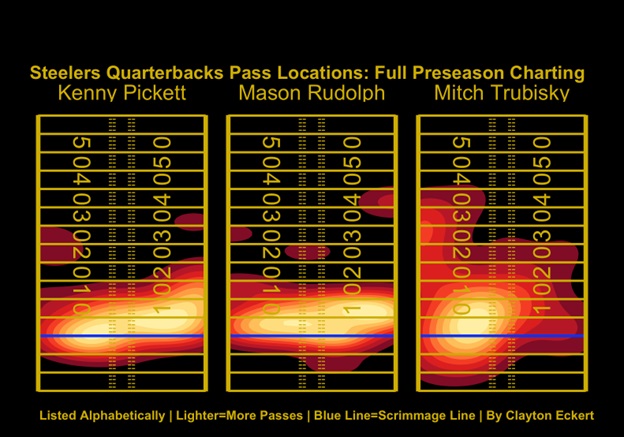
This visual looks fairly similar to last week. Pickett provided more depth on passes to the intermediate right along with a couple explosive attempts to the left, and his most common distances below ten yards. Rudolph’s chart didn’t change much with only three passes in the finale, but adding a deep middle target being notable. Trubisky has distributed downfield the most throughout the preseason, and can’t wait to see this in the regular season assuming he starts and barring injury.
With the preseason completed, I wanted to also provide a heat map with completions only for all three games, especially with a commenter requesting it as well:
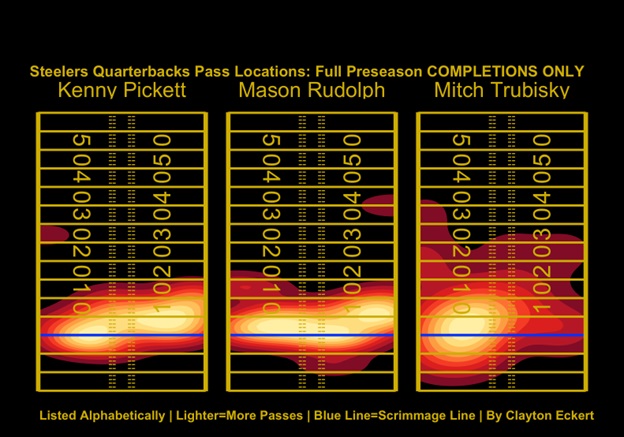
As expected, each quarterback’s chart took a hit in pass distances, especially Rudolph who was only 1/4 at 20 yard or more. Also had several incompletions between the right hash and numbers at ten yards or less, most notably in week two. His highest completion areas were at five yards or less along with outside the right numbers at a slightly deeper distance. As stated earlier, Pickett completed every charted throw less than ten yards, with more depth to the right and favoring less than five yards and screens on the left side outside the hash. Trubisky’s completion heat map gets reeled in a bit viewing only completions, especially eliminating his deep-middle 35+ yard attempts, but still a substantial difference from the other quarterbacks. A big difference is a narrower highest targeted area, on the left as expected but a shorter distance than I expected (six yards or less).
Also, here are some quarterback comparison visuals on all attempts to see how players have compared to each other throughout the preseason to close:
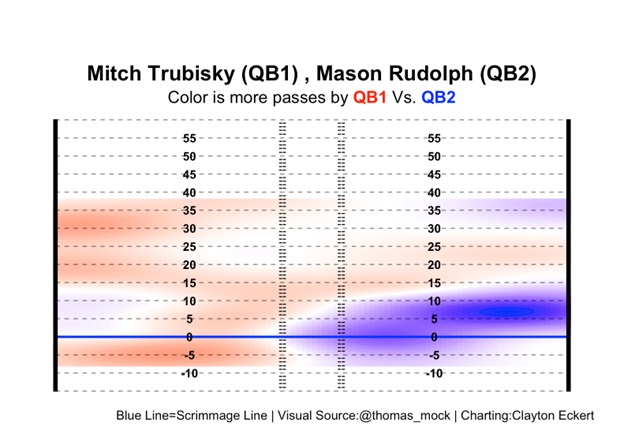
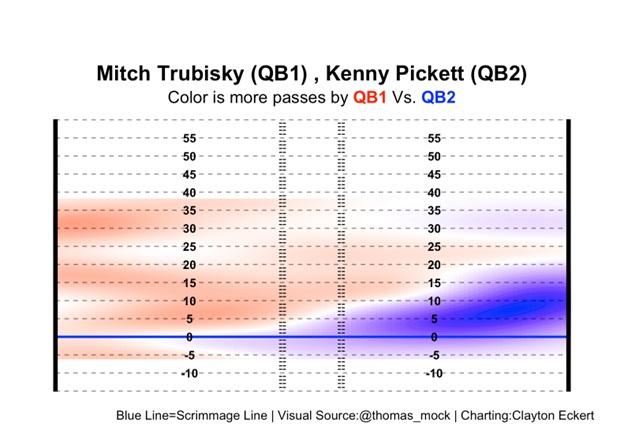
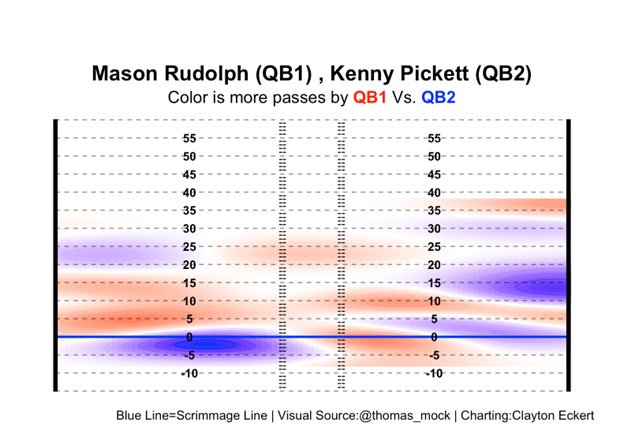
What are your thoughts on the charting and how the quarterbacks played this preseason? Thanks for reading and let me know your thoughts in the comments!