Week two of the preseason is in the books, and in case you missed the Week 1 article, I will be charting, visualizing, and providing takeaways for the all-important quarterback position for the Pittsburgh Steelers. Thanks to Thomas Mock for his great article that helped me learn much of what I’m using today. Couple notes before we jump in. All yardage referenced are air yards from the line of scrimmage and some circumstantial passes may be removed, such as spike by Kenny Pickett to stop the clock.
Let’s start with a simple overview of the position as a whole with number of throws by pass distances for Week Two:
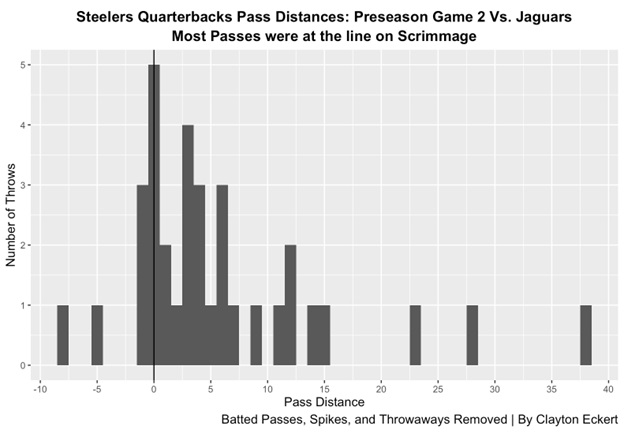
47.1% of the week two preseason passes were between 0-5 yards where quarterback Mason Rudolph threw most of his passes, and for the game in general. 17.6% of passes were between five and ten yards, compared to over 40% in week one. More passes behind the line this week, 14.7% to be exact from Rudolph (one for -8 air yards!) and quarterback Mitch Trubisky exclusively. This was also the percentage in the 10-15 yard range, highlighted by a nice seam throw by Pickett that was refreshing to see, and the other four all on the left side. Only 8% of all passes were 20 or more yards, with some of these opportunities negated by the many penalties in the game.
Here are each quarterback’s throws for week two:
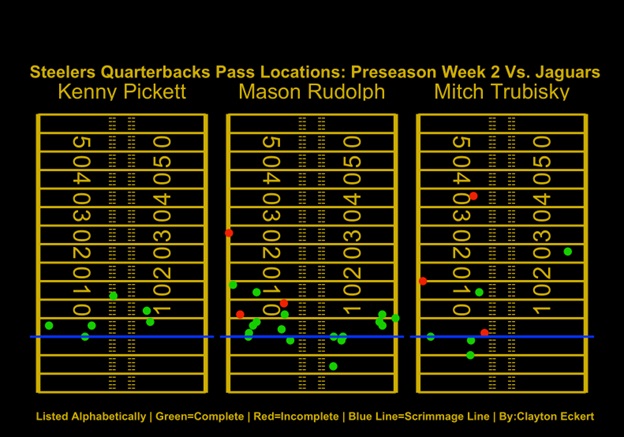
Here we get more context to the pass distances, with locations on the field and where passes were complete or incomplete. Pickett had a great showing, and with his spike removed, was a perfect 6/6 on his small ten snap sample size in the second quarter. 0-5 was yards was the most common distance, including his touchdown pass that was zero air yards. He favored short left and the only pass in the middle (on or inside the hashes) of the field for the game.
Trubisky also had a small sample size on the first three series of the game, and still see him to distribute to a wide range of areas on the field. He went 5/8 and showed great elusiveness with getting off several of these passes an achievement in itself. Trubisky had the only explosive completion the only completion and the deepest attempt though incomplete as well. Also favored the left side of the field on all but one pass.
Rudolph got the most opportunity and was 17/21, though my charting has his throwaway removed. His game winning touchdown was to the left at one air yard, an area of the field he frequently targeted. He targeted the left side at a higher rate, interesting after seeing him target the right side heavily in the first game. The dots on the right side highlight very similar targeted areas this game, just outside the hash at the line and near the sideline around five yards.
Now let’s look at the total number of throws and pass distances for the 70 throws in two preseason games:

38.6% of preseason passes through two games have been in the 0-5 yard range, the most common distance for an NFL season, and 5-10 yards the second most common by far at 30%. 17.1% from 10-15, and only 2.9% from 15-20. This emphasizes while intermediate passes are increasing, we get great context with the pass distances they have been at the lower range of the spectrum. Ten percent have been of the explosive variety, with only 2/7 of these air distances being completed. 11.4% have been behind the line of scrimmage, with a high completion rate, mostly at -1 yards.
Next, let’s look at the dots and a heat map for the quarterbacks throughout the preseason:
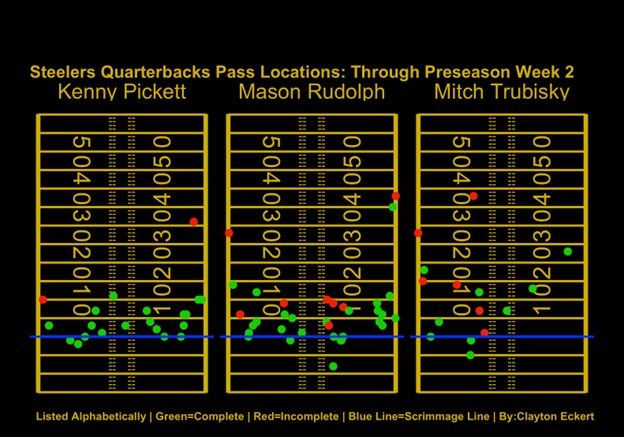
High completion rate for Pickett, albeit mostly ten yards or less with his two incompletions being close to the sidelines. The same can be said for Rudolph, with the main difference being a lower completion rate inside the numbers at ten yards or less. Trubisky has favored the left side and has five of the nine passes 15 or more yards down the field. Only four passes in the middle of the field overall, two from Pickett.
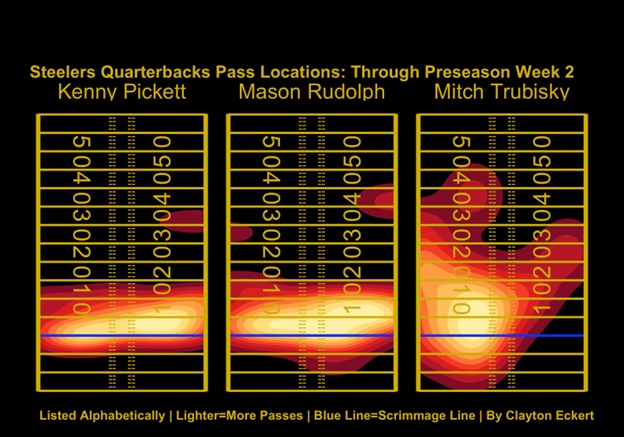
This visual has a bit more value than last week, especially with a larger sample size. Pickett still short but distributing to more areas in week two, compared to the right side of the field and intermediate in week one. The takeaway for Rudolph is similar, throwing predominantly to the right in week one but showing more variety in week two. Trubisky’s chart in both weeks emphasize the earlier point of distributing to more areas of the field, and still favoring the left side through two weeks of preseason play.
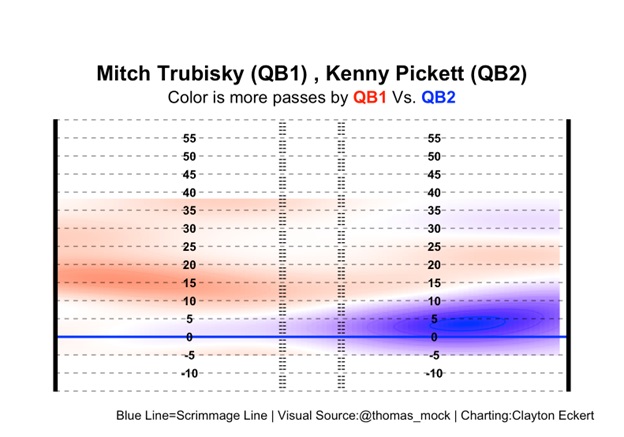
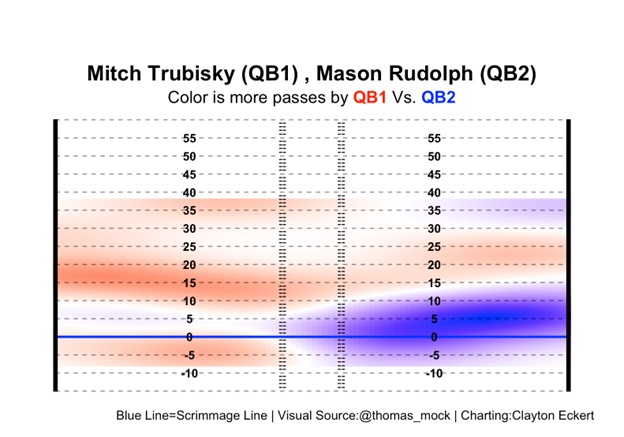
Also, here are quarterback comparison visuals to see how players have compared to each other through the preseason so far to close:

It will be interesting to see how this progresses in the final preseason game on Sunday. What are your thoughts on the charting? Thanks for reading and let me know your thoughts in the comments!


