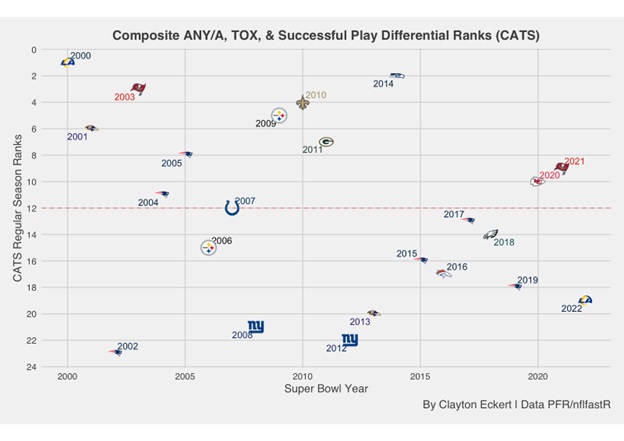
Recently I have dove deep into three important team stats, and today I wanted to provide a Cumulative Adjusted Net Yards per Pass Attempt (ANY/A), Turnovers and Explosive Plays (TOX) and Adjusted Early Down (AED) Success Rates, or CATS for short. The goal for today is to look at Super Bowl Winners since 2000, seeing how they fared in each aspect separately, and ending with the new cumulative stat.
First, let’s look at ANY/A which is defined as (Passing Yards – Sack Yards + (20* Passing TD) – 45 * Interceptions)) / (Passes Attempted + Times Sacked). Using the differential for offenses and defenses, this is the most predictive individual stat in predicting Super Bowl Winners that I have found in my studies. Since I previously broke down such teams at the ANY/A link above, here is a different visual to see how teams ranked over time:
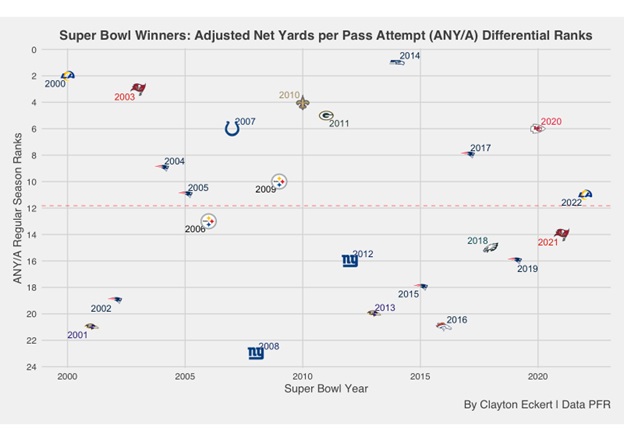
Viewing the 23 teams chronologically, we can see the stat favors the early end of the era. From 2000-2011 (the mean year), eight teams had above average ranks compared to only four since. The 2009 Steelers where one of the eight teams, landing at 10th thanks to a great defensive number of 3.2 that tied for second best but a 5.4 offensive result that tied for the fourth lowest, while the 2006 team landed just below the mean at 13th with a better 6.6 result on offense (14th) and allowing 4.7 on defense which tied for seventh best.
The strongest offensive result came from the 2017 Patriots (8.5), one of four teams with an above eight number (2020 Chiefs, 2000 Rams, and 2010 Saints), but ranked eighth in differential due to their defense allowing 5.8 which tied for second worst. The 2003 Buccaneers had the third ranked differential thanks to an elite result on defense of 2.3, with the 2014 Seahawks (top ranked differential) and 2009 Steelers tying for second at 3.2, allowing nearly a whole yard more!
The 2012 Giants and 2015 Patriots tied for the worst defensive results at 5.9, landing them lower in the differential ranks. The lowest offensive result came from the 2001 Ravens at 4.3, pushing their differential down to second worst. They were one of only two teams with an offensive result below five (2008 Giants), but kept a positive differential due to their 3.9 defensive result.
The key thresholds for Super Bowl Champions are a defensive number less than six and a positive differential (offense – defense ANY/A) considering the only team to hoist the Lombardi trophy with a negative differential was the 2008 Giants.
Next let’s look at the TOX differentials which is Turnover and Explosive Play Differentials for offenses and defenses, viewing the numbers first since I’ve yet to provide it:
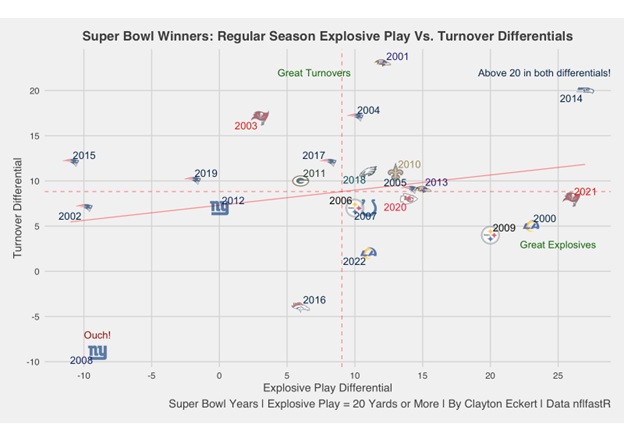
The 2014 Seahawks land alone on the top right of the graph with the top ranked explosive play differential, 63 on offense (10th) and allowing 36 on defense which tied for the second best result with the 2001 Ravens, who were the only team to best the former in turnover differential with the most takeaways (49) along with 26 turnovers. In comparison, Seattle had 39 takeaways which tied for the third highest along with 19 turnovers which tied for the seventh lowest rank. The 2004 Patriots were another other team with less than 40 explosive plays allowed on defense (39), along with the second rank with 41 takeaways (only one of two teams above 40), and tied for the third rank in turnover differential with the 2003 Buccaneers who were the final team with an above 15 number with 38 takeaways and 21 turnovers.
Four teams had an explosive play differential of 20 or more. First were the previously mentioned 2014 Seahawks, followed by the 2021 Buccaneers who had the top rank in explosive plays on offense (76) and allowed 50 on defense which tied for the 10th rank. The 2000 Rams had the second rank on offense with 73 explosive plays and were interestingly the team that tied the Buccaneers on defense. The 2009 Steelers ranked fourth in explosive play differential, with 47 explosive plays on offense which tied for the second lowest rank. This highlights them getting it done on the defensive end with only 27 explosive plays allowed. They were historically elite as the only team below 30, with nine fewer than any other team, and even more impressive context to this low number is only three other teams were below 40!
Only two teams had a negative turnover differential, 2016 Broncos (-4) and 2008 Giants (-9). The latter had the same result in explosive play differential and the only team with a negative differential in both as an extreme outlier on the bottom left of the graph. Interestingly, the Patriots were the only other team with a negative explosive play differential in 2019, 2015, and 2002, but had a positive turnover differential in all six of their championship seasons.
So, a positive turnover differential seems more predictive, as I’ve found in my prior studies, and considering the higher number of four champions having a negative explosive play differential.
Here’s a view with TOX differential ranks (Turnover Differential + Explosive Play Differential) of the above data to get a similar total view to the first graph:

Overall, there was not as strong of a trend chronologically as one might expect. Looking at the offensive and defensive numbers separately though, there were more interesting and expected findings. Since 2010, no Super Bowl offense had had less than 52 explosive plays (2016 Broncos had the fewest), compared to six teams having less than 50 previously. Similarly, all but one team had 50 or less explosive plays allowed before 2010, compared to all but two teams (2014 Seahawks and 2016 Broncos) with 50 or more on defense since. This emphasizes the shift into a more pass happy league, with the era exceptions being the 2000 Rams on offense and the 2014 Seahawks on defense.
This Seahawks group impressively topped the TOX ranks as they did in ANY/A. The 2001 Ravens ranked second, an extreme difference from their 21st rank in ANY/A. The third rank is held by the 2021 Buccaneers, compared to their 14th rank in ANY/A. The 2000 Rams ranked fourth along with their high second rank in ANY/A. The Patriots 2004 team round out the top five, pairing this with the ninth ranked ANY/A.
There was a three way tie for the sixth TOX rank between the 2013 Ravens, 2010 Saints, and 2009 Steelers. Their ANY/A ranks were 20th, fourth, and 10th respectively. The 2005 Patriots ranked ninth along with an 11th rank in ANY/A. The 2020 Chiefs and 2018 Eagles tied for the tenth rank, with varying ranks of sixth and 15th in ANY/A. Only two teams had negative TOX differentials, the 2002 Patriots and the 2008 Giants.
So, 91.3% of Super Bowl winners had a positive TOX differential, compared to the stronger ANY/A differential percentage of 95.7% since 2000. Since 2010, 100% of Super Bowl teams had positive overall ANY/A and TOX differentials!
Now for the successful play results, using AED that measured the strongest in my adjustments of success rates, and is defined as six yards or 50% of the needed yardage on first down, six yards or 60% of the needed yardage on second down, and third or fourth downs gaining the needed yardage for a first down or a touchdown:
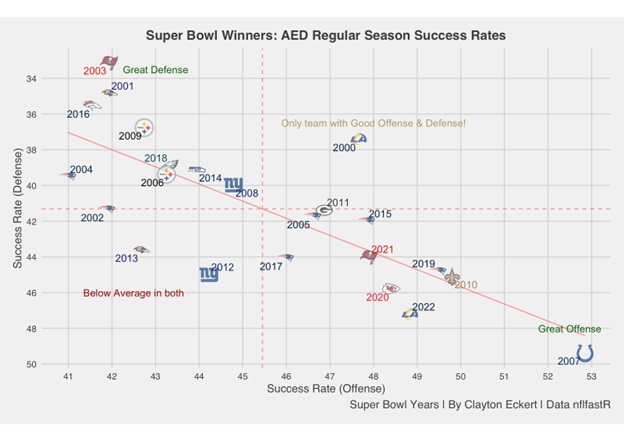
The 2000 Rams land alone on the top right of the graph with the best balanced results on both sides of the ball. Their offensive success rate of 47.65% ranked eighth along with a strong 37.42% success rate allowed on defense which ranked fifth. The strongest success rate on offense was the 2007 Colts at 52.85%, which was impressively the only team above 50%. They also allowed the highest success rate on defense (49.41%) though, one example of the high correlation to the trendline (diagonal line) overall.
Similarly, many of the top defenses had lower offensive success rates. The 2003 Buccaneers had the top ranked defense, which they also achieved in defensive ANY/A, allowing a success rate of only 33.12%, but the 19th rank on offense of 41.93%. There is a smaller gap in the results on defense with the 2001 Ravens (34.85%), 2016 Broncos (35.54%), and 2009 Steelers (36.76%) rounding out the top five with the aforementioned 2000 Rams. The lowest success rate on offense was the 2004 Patriots (40.98%) but had a stronger ninth rank on defense at 39.52%.
So, the AED success rate thresholds for Super Bowl winners are an offensive success rate above 40% and an allowed success rate below 50% on defense.
Here is a chronological ranking view of the AED success rate differentials (offense – defense) as we saw with the other two data points:
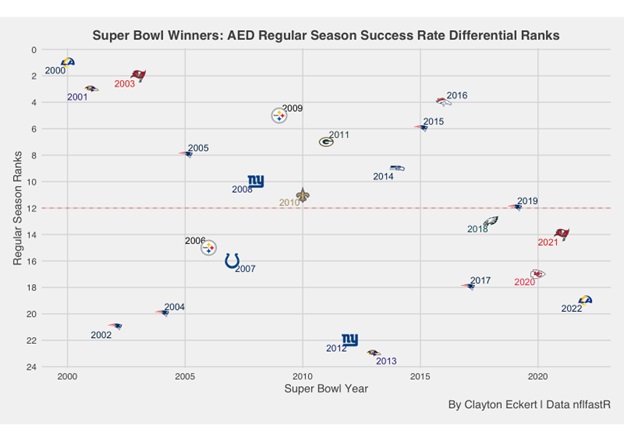
Here we can see stronger trends by year, with the top three ranks prior to 2005, eight of 12 teams from 2005-2016 (including the 2009 Steelers) above the mean in the ranks, and since 2017 teams were at the mean or below average. The top ranked 2000 Rams had an AED differential of 10.23, which was the only double digit number! The remaining teams in the top five emphasize the differentials favoring strong defenses, including the 2003 Buccaneers (8.81), 2001 Ravens (7.08), 2016 Broncos (6.01), and 2009 Steelers (5.97).
The 2015 Patriots were the sixth ranked team overall with the seventh rank on offense (47.83%) and allowing a 42.01% success rate on defense (14th). The seventh ranked 2011 Packers also fared better on offense at 46.87% (9th) along with a defensive number of 41.39 (12th). The 2005 Patriots came in at eighth, with a success rate of 46.6% on offense (10th) along with allowing 41.74 on defense for the 13th rank. The 2014 Seahawks landed at ninth, with a better defensive result of 39.13 (7th) while ranking 14th on offense (43.94%). Suprisingly the 2008 Giants round out the top ten (ranked very low in the other data points), also with a stronger defensive result of 39.98 (10th) and an offensive success rate of 44.78% which ranked 12th.
Only two teams had negative success rate differentials, the 2012 Giants (-0.78) and 2013 Ravens (-0.97) providing the same Super Bowl prediction percentage as the TOX stat (91.3%), with the latter being more predictive since 2010.
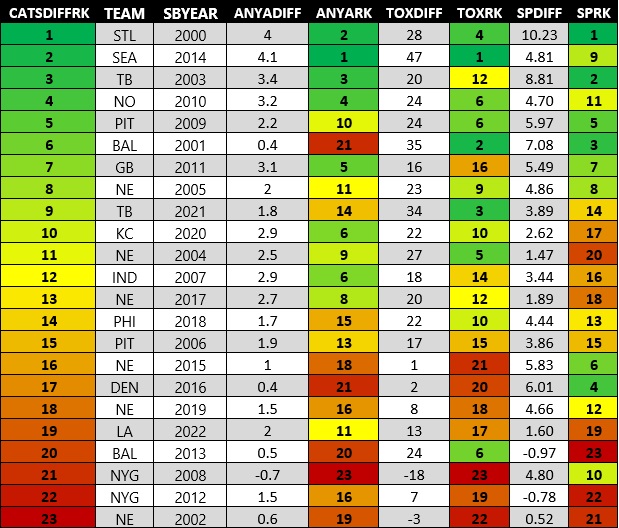
Now that we have seen the context of all the data, here’s a chronological graph of the new CATS results that factors the average rank of the three cumulative stats, with ANY/A ranks used as a tiebreaker since it was the highest predictor to winning the Super Bowl. I’ll also follow this up with a table to sum up all how each Super Bowl champion fared across the board to close:
What are your thoughts on the new CATS stat? What are your takeaways from the Super Bowl winning teams? Thanks for reading and let me know your thoughts in the comments!