Today I wanted to take a look at the successful play stat for NFL offenses that many follow, including us here at Steelers Depot. The goal for today is to look at how many measure it currently, see how the results stack up to the ultimate goal of winning, and see if tweaking the stat could possibly give us a more predictive and beneficial data point moving forward.
I provided and tracked success rates through the season, so we will start with those measures thanks to prior coding from Brad Congelio as a framework. Let’s start with a total view of pass and run plays. Here are successful play rates defined (with spikes, kneel downs, and aborted/penalty plays excluded) from nflfastR:
- First Down Success = A gain of six yards or more, or at least 40% of the needed yardage.
- Second Down Success = A gain of six yards or more, or at least 50% of the needed yardage.
- Late Down Success = A third or fourth down play gaining the needed yardage for a first down or a touchdown.

Many of us will not be surprised at the Pittsburgh Steelers 29th rank in 2021. Out of all playoff teams, Pittsburgh had the lowest rank by far and only team outside the top 20. The next lowest playoff team was their divisional opponent and Super Bowl participant Cincinnati Bengals ranking 19th. While Steelers did just enough to make the postseason with nine wins, the visual gives context to their struggles comparatively. This highlights how big of an outlier the 2021 Steelers were in total offensive success rates, and the help they needed from other teams to luckily make the playoffs. To further illustrate let’s look more broadly.
The top eight teams all made the playoffs, followed by the 9th ranked Los Angeles Chargers who had enough wins (nine) but lost out on the opportunity in a strong division, with the Chiefs and Raiders having double digit wins. The 10th-12th ranked teams were also playoff participants, highlighting 11 of the top 12 ranks (91.7%) made the postseason. The Baltimore Ravens were 13th and the first team to lack the number of wins to make the playoffs (eight). Going 1-5 in the AFC North was ultimately their demise with four of those losses coming at the back loaded divisional schedule, and quarterback Lamar Jackson missing time due to injury in three of those matchups. These dominoes are one example of Pittsburgh’s luck I mentioned earlier.
The following three teams complete the top half of the league in ranks, with the Colts (14th) and the Dolphins (16th) having the win total to reach the playoffs but were outside looking in. Washington came out with the 15th rank, the team with the lowest win total of the top 16 at seven. So, 11 of the 14 playoff teams (79%) had top 12 ranks in offensive success rates, with the Titans (17th), Bengals (19th), and Steelers (29th) as the exceptions. Strong correlation to wins and making the playoffs as the success rates stand.
Now to see if tweaks can make this better. My first thought is to increase the first down success rate from 40% of the needed yardage to 50%, considering this sets up the offense for more ideal situations on the remaining downs as opposed to the ‘if you gain four yards on every play’ stance. Let’s call this Adjusted First Down (AFD), leaving the other downs unchanged, and see how this looks in comparison:
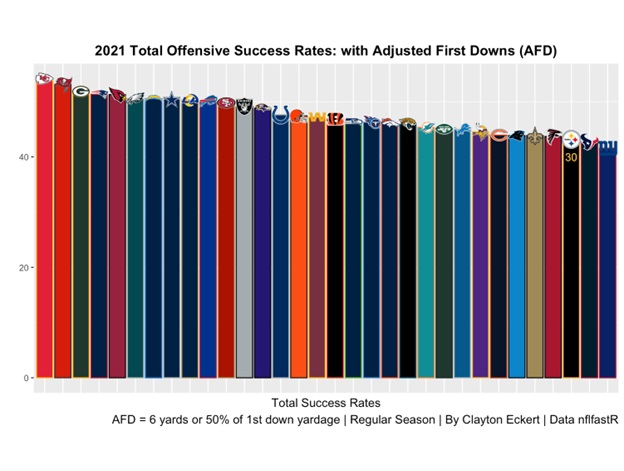
Here we see Pittsburgh moved down one spot to the 30th rank. Removing the four-yard gains on first down (that were just enough for a successful play that I recall tracking often last season), the Steelers only bested the Texans and Giants in total success rates, who remained at the bottom two spots from the previous view. Looking at the numbers for more context, Pittsburgh’s success rate on first down was 45.8% in the initial view and their rate with AFD dropped to 37.9%, each ranking 31st. They were also only one of three teams that were below 40% with AFD, compared to all 32 teams being 43% or above in the initial view.
Across the league, 11 of the top 12 ranks (91.7%) were playoff teams again, with the Chargers still being the exception and improving from ninth to the seventh rank. The Ravens and Colts remain at 13th and 14th, with a big jump from the Browns from 20th to 15th emphasizing their longer first down gains comparatively in the view with AFD. Washington rounded out the top half of the NFL with the 16th rank, one spot lower than the initial view. The Bengals improved from 19th to 17th, the Titans moved from 17th down to 19th, and Steelers fell from 29th down a spot to 30th. While the playoff prediction percentage did not change, the Bengals improvement considering their deep playoff run along with the downtrend of the Titans and especially the Steelers seem to be taking us in the right direction.
Let’s see what happens if we adjust second down as well to at least 60% of the needed yardage, while keeping AFD. I’ll call this Adjusted Early Downs (AED):
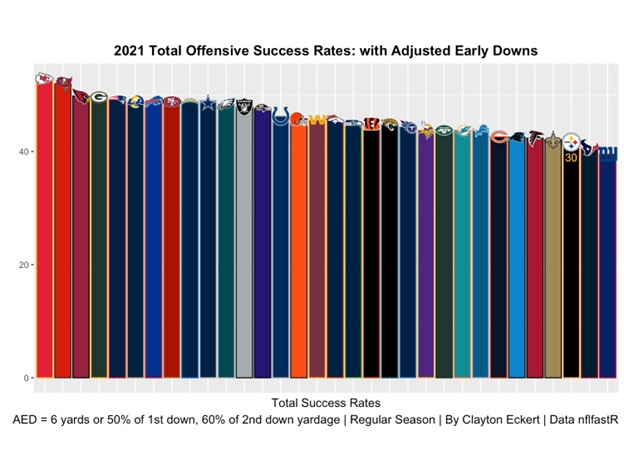
Viewing through Steelers lenses to start, we see their rank remained the same at 30th with the same teams at the bottom. Looking at the adjusted second down rates alone, Pittsburgh had their best results thus far with a success rate of 52.9% in the initial view and a 48.5% result with AED, which each ranked 21st. The top eight teams on the graph above were postseason participants like the initial view, and the playoff prediction results for the top 12 ranks remained the same (91.7%). The top 16 teams also remained the same as the with AFD view, with slightly different ranks (which I’ll illustrate in more depth later).
Next, I wanted to see if there were any predictive trends league-wide on a down by down basis, so here are first and second downs alone with AED for additional context:
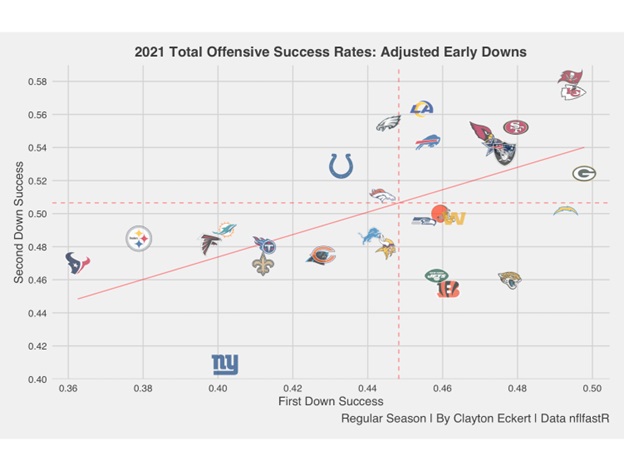
Looking at the 11 teams above the mean on each down, ten of them (90.9%) made the playoffs with the Ravens being the exception. The Bengals were above the mean on first down but poor on second down (31st), and the Eagles had a top five rank on second down with a near the mean result on first down. The two remaining playoff teams were below the mean on both downs: the Titans and Steelers. So, another strong correlation here to winning, especially for the teams on the top right.
Now let’s look at late downs (third and fourth downs) alone, which were unadjusted throughout (gaining the needed yardage for a first down or a touchdown):
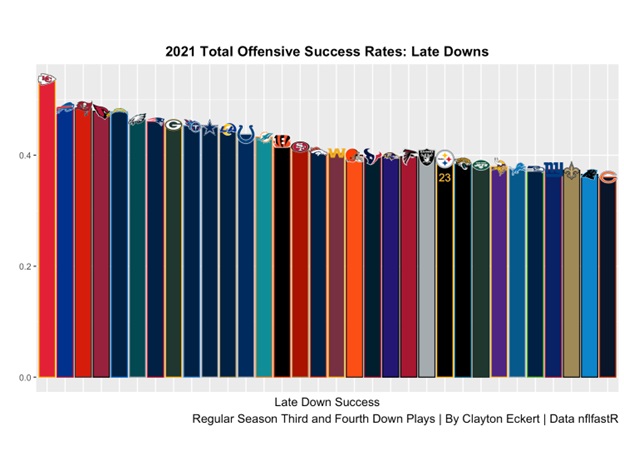
The Chiefs have ranked first throughout the article, but really separated from the rest of the pack on late downs showing great ability to extend drives. Looking at the top 12 ranks as we did in earlier views, ten of them reached the postseason (83.3%). The Titans fared better on late downs, with the 49ers and Raiders exceling on early downs. The Bengals and 49ers ranked in the top half of the league at 14th and 15th on late downs, with the Raiders (22nd) and Steelers (23rd) as the final playoff teams. So, looking at the with AED numbers by down, Pittsburgh particularly struggled on first down 37.9% (31st), fared best on second down 48.5% (21st), and had a 39.3% (23rd) success rate on late downs.
While the different views are interesting and beneficial, the adjusted numbers didn’t sway in the predictive measures to winning largely speaking in 2021. They do provide good insight to team when teams are successful that will perhaps be useful in season as I preview opponents in my game outlooks as I did last season.
After deep diving into different aspects today, I wanted to provide a table that circles back total success ranks of teams on all downs, to see where each team excelled in totality to wrap up (SPRK= Successful Play Rank initial view, AFDRK = with ADF rank, AEDRK = with AED rank, OVRRK = average of SPRK, AFDRK, and AEDRK with wins breaking any tiebreakers and stars = playoff teams):
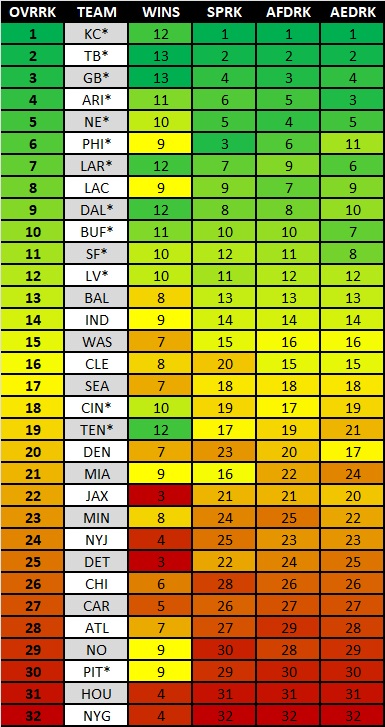
Regardless of how successful plays were weighted, the Chiefs and Buccaneers held the top two ranks across the board. The Packers matched the latter with highest win total of 13 along with third and fourth ranks respectively. The Cardinals and Patriots round out the top five in OVRRK with the former claiming the tiebreaker in wins. The Eagles rankings are interesting, clearly dropping in the AFD and AED results. The Super Bowl Champion Los Angeles Rams had top 10 ranks across the board with their best result in AED (the most demanding view on the table above). The Chargers, Cowboys, and Bills matched the Rams ranking accomplishment, and friendly reminder the former missed the playoffs. The 49ers and Raiders round out the top 12, the cutoff point for predictive measures considering everything we’ve learned from the 2021 season.
Considering all the above, I feel great about using the success rates with AED moving forward. It will be interesting to track, and especially interested in layering it with other predictive measures since one stat never tells the whole story (but I’m working on it, lol). The best singular stat to predicting Super Bowl winners in my opinion is a personal and Steelers Depot favorite: Adjusted Net Yards Per Pass Attempt that I love to track. I plan to also dive into splitting passing and rushing success rates to see if there are any valuable takeaways, and also tackling the TOX stat (turnovers and explosive plays) with a similar goal to see if adjusting the numbers/layering missing elements can provide stronger prediction tools that can be layered together moving forward.
What are your takeaways from the 2021 successful play results? Thanks for reading and let me know your thoughts in the comments!