After diving deep into success rates, I wanted to continue examining important stats that many follow. Up today is TOX, considering the strong correlation to winning since the stat was constructed by Brian Billick. The goal in this article is to examine the 2021 season from a few angles using Billick’s measurements, see how the results stack up to the ultimate goal of winning, and see if tweaking the stat could possibly give us an even more predictive and beneficial data point moving forward.
Let’s start with viewing explosive plays alone, which are a pass or run of 20 yards or more, with numbers for offense and defense on the plot below:
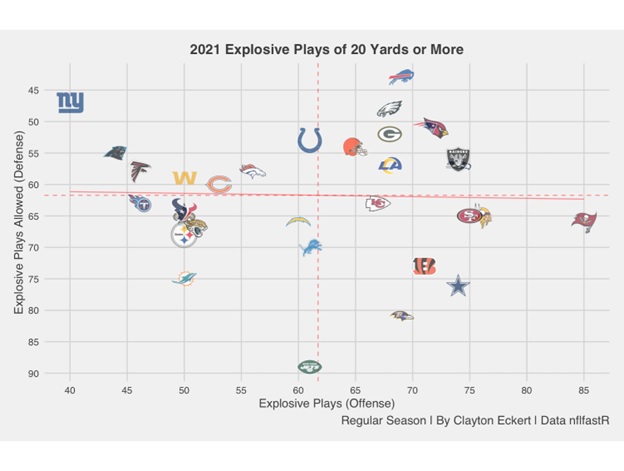
Of the nine teams on the top right, seven made the postseason (77.8%) with the Seahawks (seven wins) and Browns (eight wins) as the exceptions. When looking at the teams above the mean on offense (far right), 12 of the 14 playoff teams accomplished this feat (85.7%). This emphasizes the common narrative of the NFL as an offensive league, with explosive plays steering the success of that ship. The other side of the coin also hammers this point even further, with no playoff team on the top left (lower explosive plays allowed on defense, but low numbers on offense). The only two playoff teams below the mean in both data points were the Titans and the Steelers. Pittsburgh had 50 explosive plays on offense (T-24th with four other teams) and allowed a higher number of 68 on defense (26th) for a -18 explosive play differential (more context to come as we dive deeper). In 2021, the cutoff numbers for playoff teams were 46 or more explosive plays (with the stronger teams having 65+) and no more than 76 explosive plays allowed (with the top right teams having 57 or less).
Next let’s look at turnovers. Here’s a visual of turnovers for offenses and takeaways on defense:
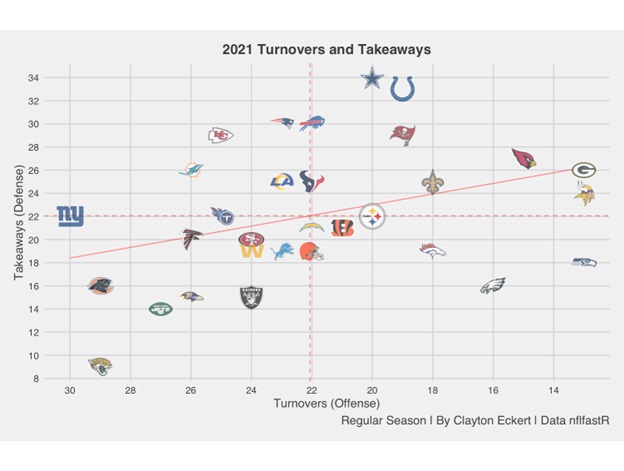
Of the ten teams on the top right, six made the playoffs (60%), with the Vikings (eight wins), Colts (nine wins), Saints (nine wins), and Texans (four wins) as the exceptions with the latter as the biggest outlier. Pittsburgh was one of the six postseason teams, with an above the mean result on offense with 20 turnovers, and right at the mean on defense with 22 takeaways for a +2 turnover differential. On the top left we see four playoff teams with stronger takeaway results, including the Patriots, Chiefs, the Super Bowl Champion Rams, and the Titans. There were two postseason teams on the bottom right with low turnovers on offense but below the mean taking the ball away on defense: the Eagles and the Super Bowl participant Bengals. The final two playoff teams were below the mean in both data points, the 49ers and the Raiders. With the 2021 numbers, the cut off numbers to make the postseason were 25 turnovers or less and 15 or more takeaways. While very important, the separate views allow us to clearly see that explosive plays had a stronger correlation to winning.
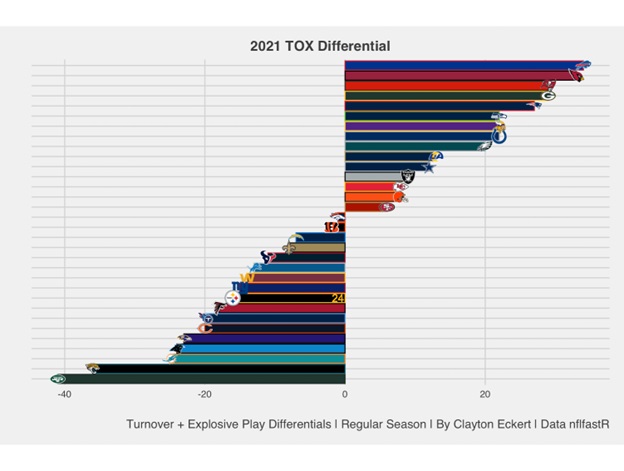
Now it’s time for the differentials around the league:
- Explosive Diff = Explosive Plays (Offense) – Explosive Plays Allowed (Defense)
- Turnover Diff = Takeaways (Defense) – Turnovers (Offense)
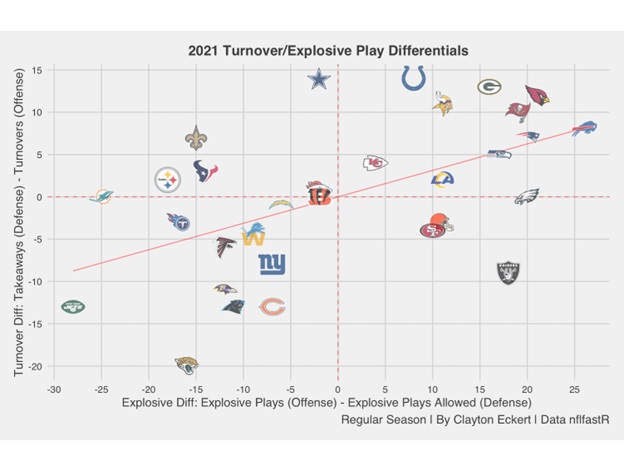
Interestingly, the mean lines in 2021 perfectly landed on zero for each data point! On the top right, eight of 11 teams made the playoffs (72.7%) with the Seahawks (seven wins), Vikings (eight wins), and Colts (nine wins) as the exceptions. Five additional postseason teams had a positive differential in one data point. The Raiders and 49ers had a positive explosive differential with the Cowboys, Bengals, and Steelers achieving this in turnover differential. The only playoff team with a negative differential in both was the Titans. So, 13 of 14 postseason teams (92.9%) achieved at least one positive differential on the graph above, for one of the strongest playoff winning percentages in my studies of 2021.
Here are the TOX Differential results in totality:
- TOX Differential = Turnover + Explosive Play Differentials
The top five were all playoff teams, with particularly strong results from the Bills and Cardinals. Three of the next four teams missed the postseason, with the Eagles punching their ticket. After a drop off, five of the remaining six with positive differentials were playoff teams, including the Super Bowl champion Rams. So, 11 of 14 playoff teams had a positive TOX differential (78.6%), with the Super Bowl participant Bengals, Steelers, and Titans as the exceptions. Pittsburgh had a -16 TOX differential (24th), with their best mark at +2 turnover differential (T-13th) but a -18 explosive play differential (30th). This provides specific context to the dire need for improvement in the latter that many of us at Steelers Depot have been clamoring for, and here’s to hoping the 2022 season is a step in the right direction for Pittsburgh’s young offense, hopefully with deeper passing overall and hopefully in turn opening a few more in the running game that were so scarce last season.
Now let’s see if tweaks to the stat even better. There have been many great discussions on the Terrible Podcast between Dave Bryan and Alex Kozora regarding explosive plays, especially of the double and triple variety, and of course the greatest value if the play ends up in the end zone. I couldn’t agree more, so these are the first adjustments I made, keeping the count of all explosive plays of 20 yards or more, if the play was a double explosive of 40 yards or more adding a multiplier of two, and triple explosive plays of 60 yards or more multiplying by three. For every play that ended in the end zone, I multiplied by six to give the greatest emphasis on the ultimate goal of scoring points. I also calculated this for the defensive side of the ball, and here are the results:

The biggest thing that sticks out right away is the Bengals improvement to the top rank on offense, with the fourth most double explosive, tied for the second most triple explosive, and most importantly the highest touchdown score on explosive plays. Looking at the playoff prediction percentages, only five of nine teams on the top right made the playoffs (55.6%) for one of the lowest results in my studies compared to 77.8% in the initial view. When looking at the teams above the mean on offense (far right) 10 of 14 made the postseason (71.4%) compared to an 85.7% initial result. The Eagles and Titans were the two playoff teams landing on the top left of the graph, compared to none in the initial view. The remaining playoff teams that were below the mean in both data points were the Raiders and the Steelers. Pittsburgh was tied for the fifth lowest explosive plays, tied for eighth in double explosives, but no triple explosives and tied for the second lowest touchdown score.
Surprising results thus far, so let’s see if adjustments for turnovers and takeaways provide value. I’m keeping the initial tallies of each, and the first thing I wanted to try is layering the same adjustments from explosive plays, but a slightly different point system to account for fewer quantity of plays in comparison to offenses. If an interception or fumble recovery return was explosive (x2), double explosive (x3), triple explosive (x4), or a touchdown (x6). Also, I wanted to add other plays that resulted in a change of possession that weren’t punts, so tallies of fourth down fails and missed field goals are included in my adjustments. Again, I calculated this for offense and defense, and here are the results:
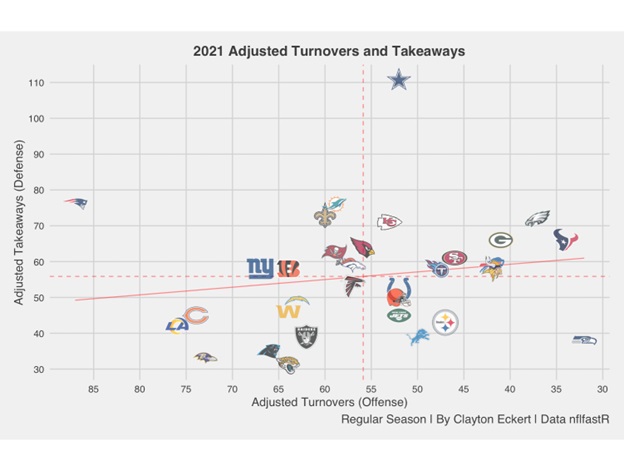
Right away we can see the adjustments highlight the Cowboys far and away value on defense, with the most takeaways, tied for third most explosive, most double explosive, tied for the most triple explosive, highest touchdown score, second most fourth down fails forced, and their lowest result being tied for third fewest field goals missed when defending. Eight out of ten teams on the top right (80%) made the playoffs, compared to only 60% in the initial view. So, the adjustments here provide a stronger predictive measure as I hoped.
The Steelers were the only postseason team on the bottom right, remaining above the mean on offense but a lower result in the adjusted defensive view. Pittsburgh was tied for 14th in takeaways, tied for the lowest explosive, tied for the second lowest double explosive, no triple explosives or touchdowns and tied for the third fewest field goals missed when defending for the 25th overall rank on defense. They did have a strong 12th rank in fourth down fails forced, and an eighth overall rank on offense.
Now that we’ve viewed the results for offense and defense, let’s get to the adjusted differentials:

Eight of the 11 teams on the top right (72.7%) were postseason teams, which matched the results in the initial view. Three additional playoff teams were above the mean in explosive diff, including both squads featured in the Super Bowl, and the Titans were above the mean in turnover diff. The Raiders and Steelers were the only postseason teams with a negative differential in both data points. So, 12 of 14 playoff teams (85.7%) had at least one positive differential compared to 92.9% in the initial view.
To close, here are the adjusted TOX (ATOX) differentials in totality:
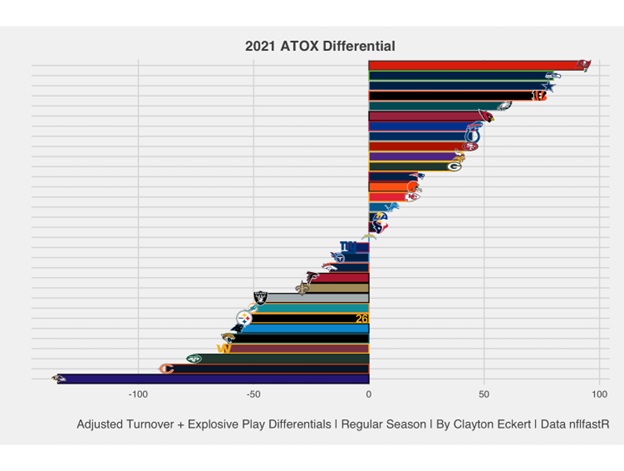
The Buccaneers land at the top rank in ATOX, along with six of the top seven making the playoffs for a higher correlation in the top ranks than TOX. 11 of 14 playoff teams had a positive differential (78.6%) which matched the playoff prediction percentage in the initial view. An improvement in the adjustments were that both teams in the Super Bowl had positive differentials, compared to the initial view where the Bengals were in the negative. The Raiders dropped from a positive to a negative differential in the ATOX view, joining the Titans and Steelers who remained in this range with the lowest result of any playoff team.
With the 2021 numbers, the original TOX measurements were very predictive as is. The most noticeable improvements with ATOX were in turnovers, and the more layers that were added provided an equally predictive data point with much more context in my opinion.
This will be interesting to track further, and especially interested in layering other predictive measures since one stat never tells the whole story (but I’m working on it, lol). The best singular stat to predicting Super Bowl winners in my opinion is a personal and Steelers Depot favorite: Adjusted Net Yards Per Pass Attempt that I love to track. I look forward to layering this with ATOX and success rates with historical data to see how to get the best predictive measures moving forward.
What are your takeaways from the 2021 TOX and new ATOX results? Thanks for reading and let me know your thoughts in the comments!