Today, I wanted to share my Pittsburgh Steelers quarterback passing locations for the full 2025 preseason.
A couple of notes before we jump in. Thanks to Thomas Mock for his great work that helped me learn much of what I’m using visually. Spikes and clear throwaways are removed due to being the correct situational decision, along with bats at the line of scrimmage.
Let’s start with a simple view of all 92 charted passes, with the number of throws at each pass distance:
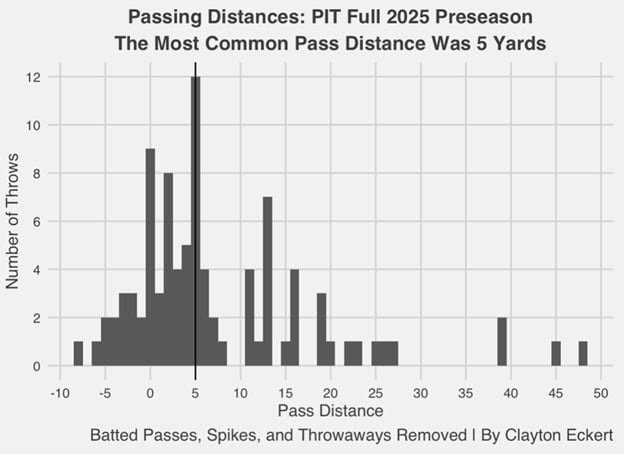
#1. 0-5 air-yards: 44.6-percent. If you’ve followed these articles in the past, you know that five yards has been the most common pass distance for the Steelers and for most NFL teams. Zero to five air yards dominate the target share this preseason. For comparison, last preseason was 38.7-percent, compared to a regular season number of 40.3-percent.
#2. 5-10 air-yards: 20.7-percent. This isn’t surprising, especially during the preseason, when teams tend to be more conservative. Lots of out, stops, and flat routes, for example.
#3. Behind-the-Line: 15.2-percent. Keeping the theme going is the third most common pass distance. Think screens in particular, which Pittsburgh has famously struggled with in the past, but actually scored a touchdown on one (is that legal?).
#4. 10-15 air-yards: 14.1-percent. Though the earlier points are valid, we did see some nice plays downfield. This pass distance was four whole percentage points higher than the 2024 regular season.
T-last. Explosive (20-plus air-yards): 10.9-percent. One player in particular accounted for most of these attempts, which we will see more clearly on the upcoming charts in a moment. Last regular season, 14.3-percent of charted passes were explosive.
T-last. 15-20 air-yards: 10.9-percent. This is an area I have noted that the Steelers could utilize more for quite some time. Last year came in at only 7.2-percent, so I’m ready to see what that looks like in the 2025 regular season.
Here is a dot chart of completions/incompletions:
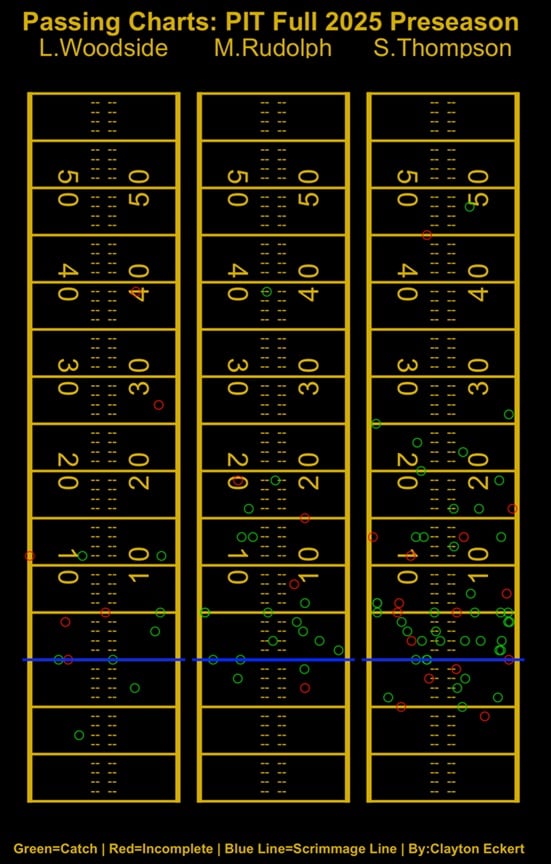
Skylar Thompson got the most playing time and impressed overall this preseason. He was also the most aggressive downfield and threw for four touchdowns and one interception. Mason Rudolph also had nice moments but was more conservative and had two TDs and an INT, with the performances trailing off in each game. Logan Woodside played sparingly, engulfed on the depth chart and no longer a Steeler (cut).
Completion Rates By Distance:
RUDOLPH:
Behind-the-line: 2/3 (66.7-percent)
0-5 air-yards: 10/10 (100.0-percent)
5-10 air-yards: 4/5 (80.0-percent)
10-15 air-yards: 2/3 (66.7-percent)
15-20 air-yards: 2/4 (50.0-percent)
Explosive: 1/1 (100.0-percent)
Rudolph’s most common pass distance was 0-5 air yards, with a perfect completion rate on ten passes—nice 80-percent completion rate at 5-10 air yards too. The rest isn’t ideal, and I wanted to see more than one explosive air distance for sure.
THOMPSON:
Behind-the-line: 5/9 (55.6-percent)
0-5 air-yards: 20/24 (83.3-percent)
5-10 air-yards: 8/12 (66.7-percent)
10-15 air-yards: 4/7 (57.1-percent)
15-20 air-yards: 4/5 (80.0-percent)
Explosive: 6/7 (85.7-percent)
Interestingly, Thompson’s best completion rate was on explosives (85.7), which I don’t believe I’ve ever seen since charting Steelers pass locations. 80-plus completion percentages are great at any distance, which he also did at 0-5 and 15-20 air yards.
WOODSIDE:
Behind-the-line: 2/2 (100.0-percent)
0-5 air-yards: 4/7 (57.1-percent)
5-10 air-yards: 1/2 (50.0-percent)
10-15 air-yards: 2/3 (66.7-percent)
15-20 air-yards: 0/0 (N/A)
Explosive: 0/2 (0.0-percent)
Here, we get a sense of the low number of opportunities. There was a perfect rate behind the line, but on just two charted passes. 10-15 was another bright spot (three attempts, though). The rest isn’t ideal, along with a zero-burger in explosives (two attempts).
Completion Rates By Location:
RUDOLPH:
Outside left numbers: 3/3 (100.0-percent)
Left numbers-left hash: 5/6 (83.3-percent)
Inside hashes: 4/4 (100-percent)
Right hash-right numbers: 4/7 (57.1-percent)
Outside right numbers: 2/2 (100.0-percent)
Outside the numbers and inside the hashes featured perfect completion rates, but it is important to remember the low sample size. Between the left numbers and hash were also strong, with that area on the right side of the field clearly being the worst for Rudolph.
THOMPSON:
Outside left numbers: 6/10 (60.0-percent)
Left numbers-left hash: 9/13 (50.0-percent)
Inside hashes: 3/3 (100.0-percent)
Right hash-right numbers: 12/15 (80.0-percent)
Outside right numbers: 11/15 (73.3-percent)
Thompson was perfect in one location – inside the hashes. Makes sense that there weren’t other perfect areas with the most playing time (by far). He did a lot of damage in the intermediate middle of the field. Refreshing to see in Pittsburgh, considering head coach Mike Tomlin has stated that’s where more turnovers occur (which my research validated).
WOODSIDE:
Outside left numbers: 1/2 (50.0-percent)
Left numbers-left hash: 2/4 (50.0-percent)
Inside hashes: 1/2 (50.0-percent)
Right hash-right numbers: 1/2 (50.0-percent)
Outside right numbers: 3/4 (75.0-percent)
Outside the right numbers were clearly his best, but not much to glean from four passes or fewer at each location. Because of this, and being cut, I will exclude Woodside from the rest of the article.
Now for the heat maps of charted passes for Rudolph and Thompson, and then their completions only:
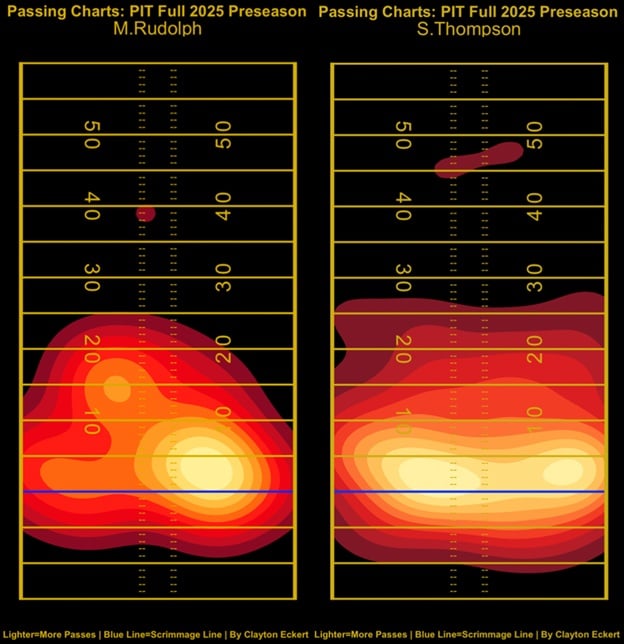
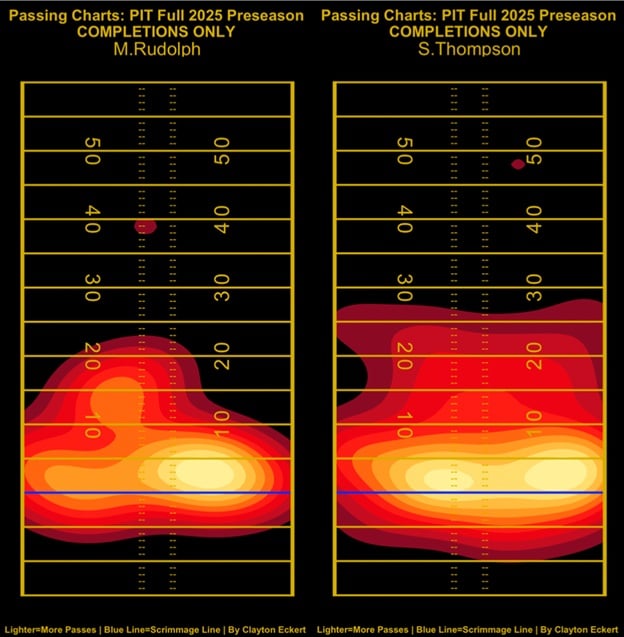
These charts show a clear difference in how the two quarterbacks utilized the field this preseason. Both of Thompson’s charts were wider, re-emphasizing how he was more aggressive. His completions-only chart was nearly identical to all attempts, quantifying his nice play when compared to someone like Rudolph.
Both are still on the roster, so it will be very interesting to see who sticks with the team and in what capacity (53-man roster, practice squad, etc.). Aaron Rodgers and Will Howard didn’t play at all, one as a safety precaution for a grizzly vet and starter, and the other as a rookie hoping to return from injury soon.
What are your thoughts? Thanks for reading.