The screen game can be an effective tool to keep defenses off balance, a high percentage pass with YAC potential if schemed and executed well. Today I wanted to look at and provide data context for how the Pittsburgh Steelers have fared compared to the rest of the NFL in 2024, and past seasons.
For starters, the Steelers have 35 screen attempts in 2024, which ties for 25th in the NFL. Through Week 14, that averages to 2.7 attempts per game. Extrapolating that for the rest of the season, they are on pace for roughly 45 attempts, comparable volume to last season, and screen passing for OC Arthur Smith his last two seasons as Atlanta’s head coach.
So, not much quantity, but what about the quality? Let’s examine that, starting with boom and bust rates:
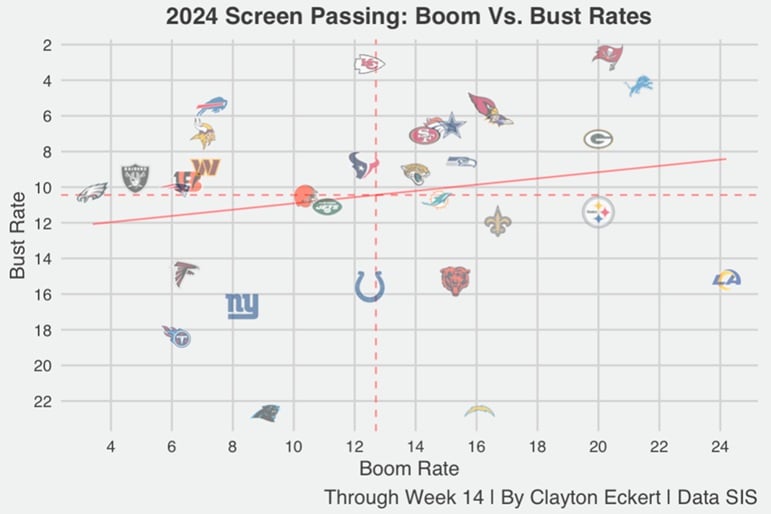
- Boom Rate – rate of passes with an expected points added (EPA) greater than 1.
- Bust Rate – rate of passes with an expected points added (EPA) less than –1.
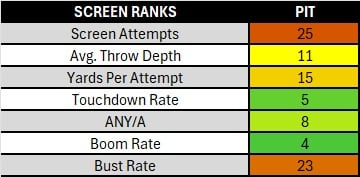
Right away, we see the volatile results of Pittsburgh’s screen game. The great news is a 20-percent boom rate, tying for fourth-best in the league. We’re seeing far more value added on screen plays, compared to a 6.1 number that ranked next to last in 2023, as well as Smith’s results last season (12.2, 15th).
The other side of the coin is an 11.4 bust rate for Pittsburgh this season, ranking 23rd. It has felt like either a nice play with YAC, or a loss of yards far too often. Hopefully Pittsburgh can eliminate the negative plays more during the rest of 2024.
Decisions on when to use it could aid that goal. Last week was a good example, running them multiple plays in a row or the same drive, and typically worse outcomes on second attempts. But overall, it’s great to see the best screen game in Pittsburgh since QB Ben Roethlisberger retired.
Let’s look at some numbers on the receiving end:
RB Najee Harris: 7 Rec, 93 YDs, 131 YAC, 15 YAContact, 3 MTAK, 4 1DNs, 0 TDs.
RB Jaylen Warren: 7 Rec, 53 YDs, 85 YAC, 41 YAContact, 2 MTAK, 2 1DNs, 0 TDs.
WR George Pickens: 6 Rec, 25 YDs, 36 YAC, 13 YAContact, 1 MTAK, 1 1DN, 1 TD.
WR Calvin Austin: 4 Rec, 23 YDs, 25 YAC, 12 YAContact, 0 MTAK, 1 1DN, 0 TDs.
RB Cordarrelle Patterson: 3 Rec, 3 YDs, 14 YAC, 3 YAContact, 0 MTAK, 1 1DN, 0 TD.
TE Pat Freiermuth: 2 Rec, 13 YDs, 18 YAC, 14 YAContact, 0 MTAK, 1 1DN, 1 TD.
WR Van Jefferson: 1 Rec, 1 YD, 6 YAC, 2 YAContact, 0 MTAK, 0 1DN, 0 TD.
As expected, the Steelers RB duo lead the way in volume, yardage, forced missed tackles, and chain moving screen plays. Harris averaged 13.3 yards per catch, and 18.7 yards after catch, despite it not being after contact as often as his rushing. Different story for Warren, who substantially leads the team with 41 yards after contact, at 5.9 per attempt to Harris’ 2.1.
Warren has 7.6 yards per catch, and 12.1 yards after catch, creating more while playing often in obvious passing situations where the defense is expecting it more. Both players deserve a ton of credit for Pittsburgh’s improved screen game.
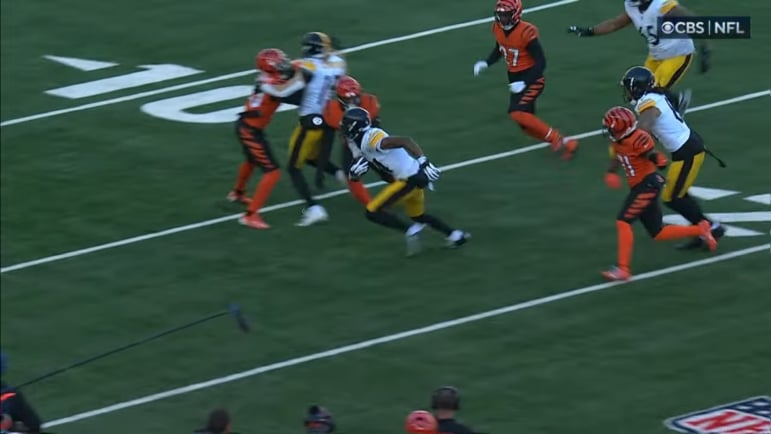
The ultimate goal is to get on the scoreboard, and seeing two touchdowns for the Steelers is obviously fantastic. One was from the third most targeted Pickens, with his 17-yard TD against the Bengals featuring his missed tackle and first down as well. That accounted for the majority of his 25 screen yards on six catches though, so boom/bust results.
Freiermuth had the other score, back in Week Five against the Cowboys, a flip pass from six yards out. It’s been nice to see that play used less than under former OC Matt Canada, which failed often in past seasons with its predictability.
While Smith uses tight ends in the flat frequently, only two screen targets to Freiermuth this season seems criminal. Encouragingly had one last Week against Cleveland, and maybe another in Week 15 with more targets available, as Pickens likely missing another game.
Austin is another candidate, who has done some good things in terms of yardage (5.8 yards per catch), and might be wise to limit the use of others like Patterson and Jefferson considering their poor results overall.
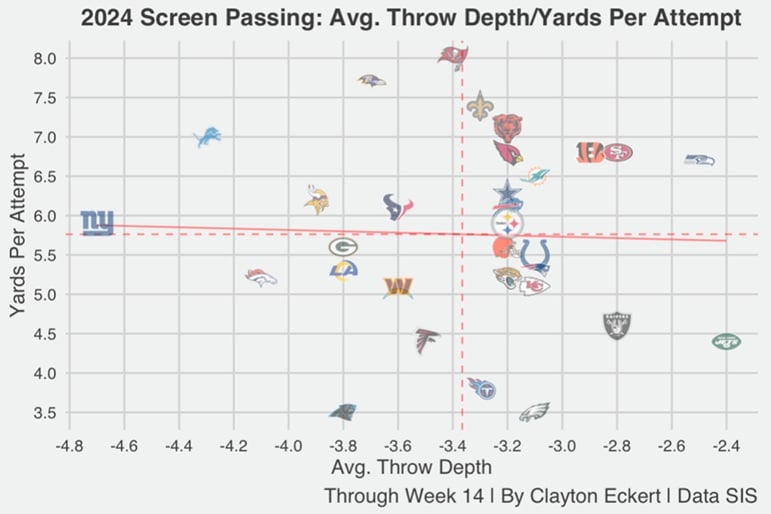
Zooming back out to a team level, here are average throw depths and yards per attempt:
On the whole, things could stand to improve, particularly in yards per attempt. Despite having an above the mean average throw depth that ties for 11th with several teams, Pittsburgh is just above average with 5.9 yards per attempt that ties for 15th in the NFL.
While that is true, it is already much better than the last five seasons:
Steelers YPA:
2019: 4.7 YPA.
2020: 4.5 YPA.
2021: 4.1 YPA.
2022: 4.6 YPA.
2023: 4.1 YPA.
2024: 5.9 YPA.
Thankfully, the Steelers are getting over a yard more on average on screen plays than the previous five seasons, when they were horrendously below average in the entire span. One of the many elements that has looked better under Smith, who was above average three years in the span, including last season and a second-best mark of any team from 2019-2023 back as OC with the Titans.
No surprise from my studies that I linked at the beginning of the article, with Smith deserving credit for overall offensive improvements, including the Pittsburgh Steelers screen game.
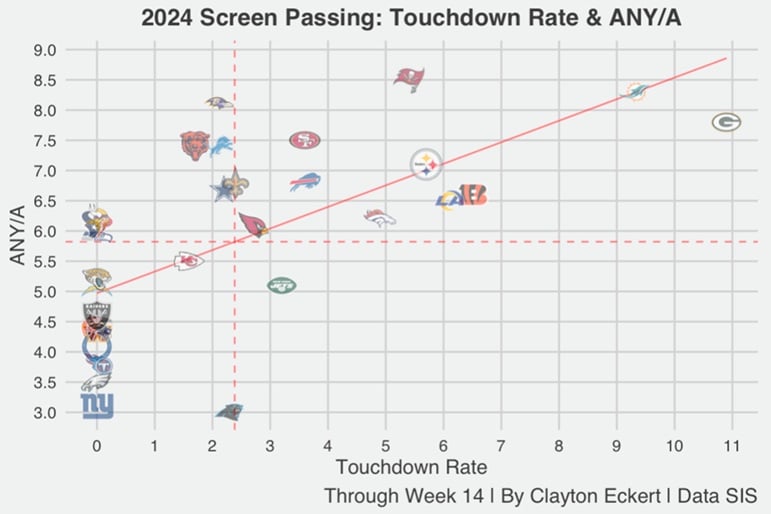
I also wanted to see how Pittsburgh’s two TDs fared across the league with touchdown rates, along with Adjusted Net Yards per Attempt (ANY/A = ([Pass Yards] + 20[Pass TD] – 45[Interceptions] – [Sack Yards])/([Attempts] + [Sacks]).), one of the best all-encompassing stats to measure passing success:
The Steelers sit pretty in both stats, with a 5.7 touchdown rate that ranks fifth, and a 7.1 ANY/A that lands at eighth-best. So great to see them land comfortably above the mean, and the majority of the NFL.
They have also been much better in each since the 2019 season:
Steelers TD Rates and ANY/A:
2019: 1.9 TD rate. 5.1 ANY/A.
2020: 2.5 TD rate. 5.0 ANY/A.
2021: 4.5 TD rate. 5.0 ANY/A.
2022: none. 4.6 ANY/A.
2023: none. 4.1 ANY/A
2024: 5.7 TD rate. 7.1 ANY/A.
Wow. Pittsburgh ended a two-year drought of no screen touchdowns this season, along with posting an ANY/A that’s two full points above any other season since 2019. Well below league average in that span overall, and all five seasons in ANY/A. Roethlisberger’s final 2021 season was the only glimmer of hope, with a respectable TD rate.
Yes, Smith’s results were better at his previous coaching spots once again, as you probably expected. Particularly in the same two seasons I referenced earlier (2019 and 2023). From 2019-2023, Smith achieved a sixth-best 8.9 ANY/A with the 2019 Titans, and more recently the absolute-best 10.2 TD rate last year with Atlanta.
Both stats have been better across the board for Pittsburgh this year, a fantastic breath of fresh air, and the screen game is no exception. Smith’s potential impact was clear to see on paper, and so glad it has come to fruition in the Steel City.
To close, here is a rankings table of the 2024 data I compiled for the study:
Thanks for reading and let me know your thoughts in the comments.

