Today I wanted to look at and give some love to a position that is often underappreciated, punters. Continuing the series I began in the 2023 regular season, the goal today is to look at some important existing metrics, along with pairing in some new data to add situational context.
The position for Pittsburgh has experienced much turnover, with the unfortunate injury to Cameron Johnston, occurring on his third regular season punt attempt (negated). He was displaying difference maker qualities in the offseason, devastating for him and the thought of what could have been.
Chris Boswell was required to punt for the first time in his long tenure in the league following that in-game injury, a valiant effort given that he’s a kicker. Then the Steelers brought back Corliss Waitman, who had a previous stint with the team in 2021, playing the last two games.
Let’s see how things have stacked up for all punts across the league through Week Three.
Here’s an outline of the punting metrics:
- Punts (Att).
- Average Yard Line (AYL) = ex. punt from Pittsburgh’s 20 = 80 yard line, Opponents 45 = 45 yard line).
- “Punt yards achieved” (PYA) = a new idea/metric, which is punt yards / yard line.
- Yards per attempt (YPA).
- Average NET yards (NET) = yards punted – return yards – (touchbacks x 20) / punts.
- 50+ rate (50+).
- Inside the 20 rate (in20).
- Inside the 10 rate (in10).
- Returned rate (Ret).
- Yards Per Return (YPR).
- Fair Catch rate (FC).
- Touchback rate (TB).
- Average hangtime (HT).
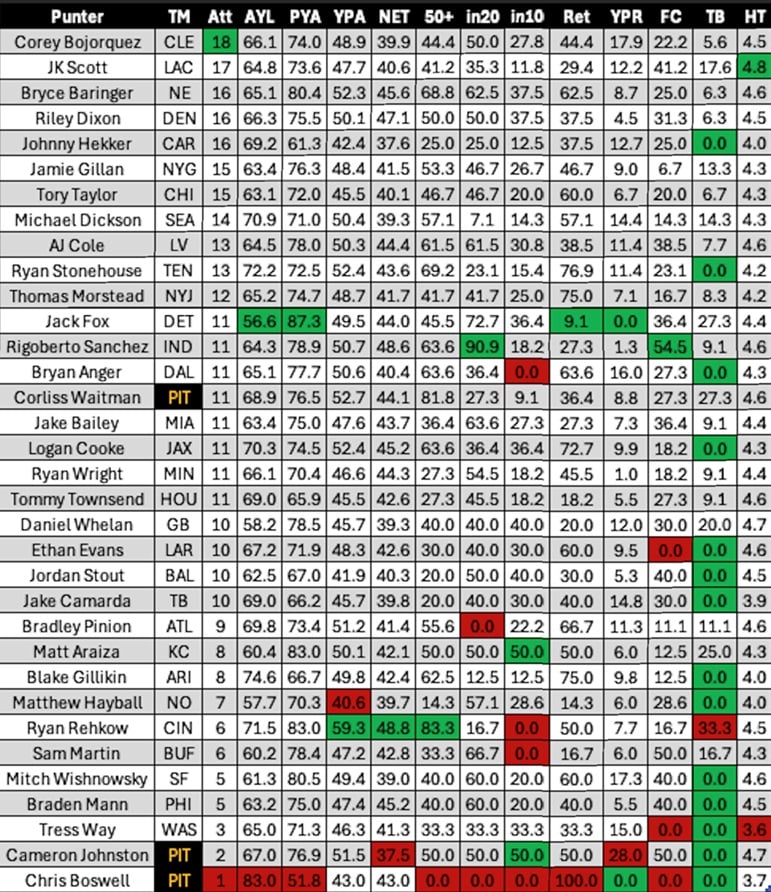
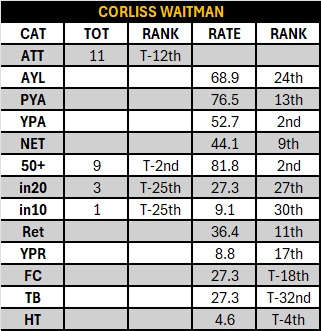
Here are the 2024 league results (for the die-hards) through week three, followed by a summarized table for Waitman including his ranks:
While the sample size is small for the other Steelers, we see Johnston’s tied league-bests with no touchbacks and one inside the 20 on his two attempts. The return units deserve most of the blame for his dead last ranks, a 37.5 NET and 28.0 YPR.
Boswell’s results were low as expected on his emergency punt. His 43.0 YPA and 3.7 hangtime wasn’t the lowest around the NFL as you might expect though, and the coverage and tackle was fantastic from Scotty Miller for a no gain return.
The table breakdown of Waitman really shows his strengths and weaknesses so far. Out of the 34 qualifying players with punts this season, he ties for 12th in number of attempts. The best news has been second ranks in YPA (52.7), 50-plus punts (nine), 50-plusrate (81.8), along with a top-five rank in hangtime (4.6, T-4th). He clearly has a strong leg, and the numbers give context to how well that has stacked up among his peers.
Waitman’s 81.8 rate of 50-plus yarders is fantastic, trailing only Cincinnati rookie Ryan Rehkow (83.3). Third place comes in substantially lower at 69.2, a solid punter in Titans Ryan Stonehouse. It’s not like Waitman has a low number of attempts that skew the results, so rather impressive feat he’s accomplished in this young season.
The flipside is revealed through the other numbers though. Booming punts do no good if they go for touchbacks, which Waitman ties for third-most (T-32nd) out of the 34 qualifying punters. That was particularly the case in his Week Two debut, and thankfully trended positively the following game.
In turn, his other lowest results have been in placement, unfortunately with a 27th ranked in20 rate, and 30th in10 rate. Three punts inside the 20, and one inside the ten each tie for 25th. Encouragingly, last game featured the inside the ten punt, so a positive trend that hopefully continues.
Let’s break the ranks down further:
Top Five Ranks: YPA (second), 50+ rate (second), 50+ punts (T-second), hangtime (T-fourth).
Above-Average Ranks: NET (ninth), returned rate (11th), attempts (T-12th), punt yards achieved (13th), YPR (17th).
Below-Average Ranks: fair catch rate (T-18th), average yard line (24th), punts in20 (T-25th), punts in10 (T-25th), in20 rate (27th).
Bottom Five Ranks: in10 rate (30th), touchbacks (T-32nd).
This view re-emphasizes the best and worst numbers that I’ve already discussed. While the bottom five are important ones to correct, having just two data points there is rather encouraging.
Above-average ranks show the punt coverage units have fared well on his attempts, contributing to a solid NET, returned rate, and yards per return. Thankfully, much better results than they had on Johnston’s punts that will hopefully continue. Seeing Waitman’s 76.5 PYA (punt yards achieved) at 13th despite a less-than-ideal average yard line (24th) is also good to see.
Another slightly below-average mark was fair catch rate, but otherwise the main word to summarize what must improve is placement. As mentioned earlier, we did see a positive trend in his second game, so hopefully we see that continue to transpire on the field and in future studies moving forward.
That is the crucial hope with how Pittsburgh is built, relying on their strong defense along with ball control and the field position battle. Hopefully we see Waitman become a valuable piece of that important puzzle.


