Today, I wanted to look at a position and some stats that are often underappreciated: Steelers punting metrics. A great idea was emailed to the Terrible Podcast last off-season, making the point that most public punting data excludes important context at times, and I agree wholeheartedly. The goal today is to look at some important existing metrics, along with pairing in some new data to add situational context.
Through Week Three of the 2023 season, Pressley Harvin III was a prime example of a strong situational punter. He often kicked short punts that pinned the opposition close to the goal line, which skews yards per attempt, NET, etc., and shouldn’t penalize the player. The rest of the season played out much differently, lacking consistency and closing the year out particularly poor, which will likely lead to the team moving on in 2024.
Here’s an outline of the data I’ve summarized in the tables below:
- Punts (Att).
- Average Yardline (AYL) = ex. punt from Pittsburgh’s 20 = 80 yardline, Opponents 45 = 45 yardline).
- “Punt yards achieved” (PYA) = the new idea/metric, which is punt yards/yard line.
- Yards per attempt (YPA).
- Average NET yards (NET) = yards punted – return yards – (touchbacks x 20) / punts.
- 50+ rate (50+).
- Inside the 20 rate (in20).
- Inside the 10 rate (in 10).
- Returned rate (Ret).
- Yards Per Return (YPR).
- Fair Catch rate (FC).
- Touchback rate (TB).
- Average hangtime (HT).
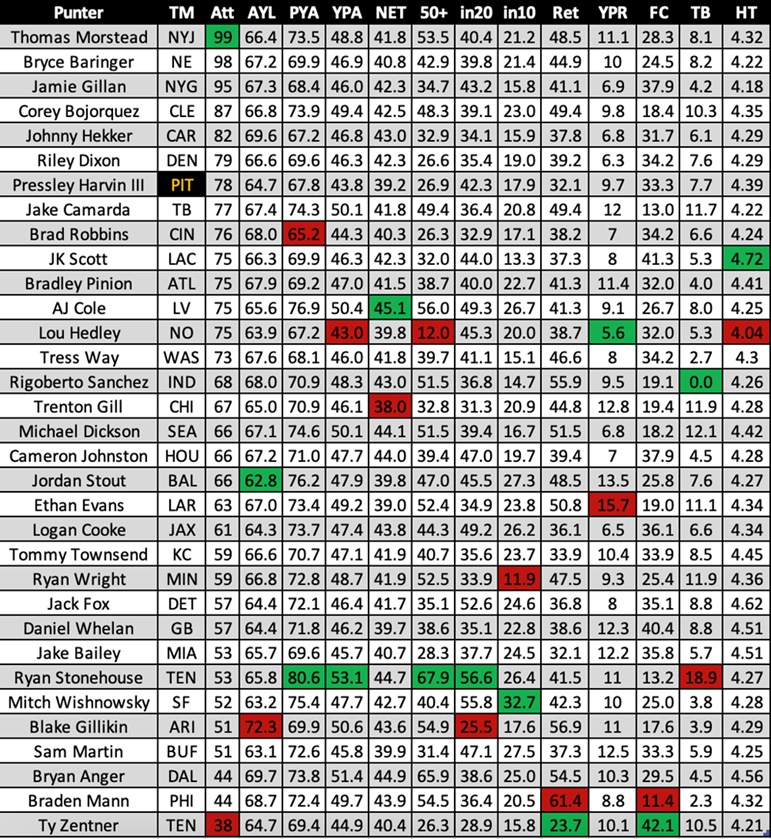
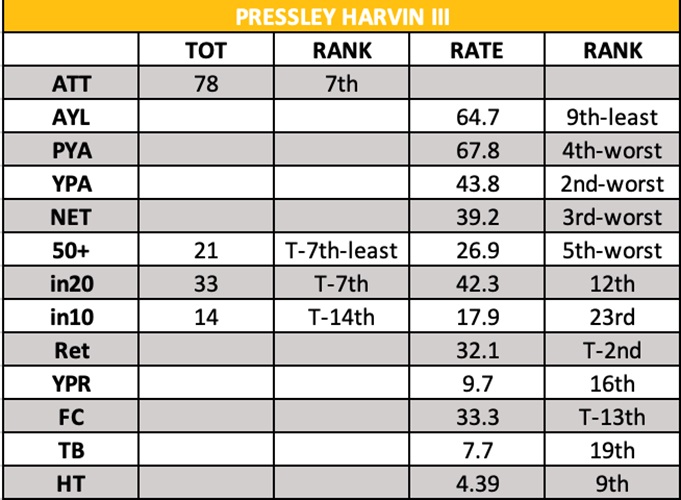
Here are the full 2023 league results (for the die-hards), including green (best) and red (worst) marks of each stat, followed by a summarized table for Harvin:
Harvin ranked seventh in attempts, along with top ten marks in return rate (32.1-percent, T-second) and hangtime (4.39, ninth) out of 33 qualifiers. On average, he did a nice job compared to his peers getting air under the football and allowing the coverage unit to get downfield and limit return opportunities. Harvin also tied for seventh with 33 punts inside the 20 from a totality perspective.
His inside-the-20 rate landed a bit lower, though, at 42.3 percent (12th), despite punting from the ninth-least average yard line (64.7). In the other metrics, he was closer to the league average with 14 punts inside the 10 (T-14th), fair-catch rate (33.3 percent, T-13th), and yards per return (9.7, 16th). The majority of his best marks came from a totality perspective, which makes sense with a high number of attempts, along with several others having to do with the coverage units.
Now for the bad news. Harvin ranked 19th in touchback rate (7.7 percent), and his inside-the-10 total fell much lower from a rate perspective (17.9 percent, 23rd). Despite the high volume, he tied for seventh-least in punts of 50-plus yards (21). Harvin was also bottom five in some of the most important metrics: 26.9-percent 50-plus rate (fifth-worst), 67.8 punt yards achieved (fourth-worst), 39.2 NET (third-worst), and 43.8 yards per attempt (next to last).
Not good enough, plain and simple. So unfortunate after a strong start to the season, including a historically good Week Three performance, which prompted the study through Week Three. I linked at the beginning of this article. Here’s how things trended this season:
THROUGH WEEK THREE:
Top ten: Attempts (first), punts inside the ten (T-first), punts inside the 20 (second), 50-plus punts (fourth), average yardline (fifth-least), inside the 10 rate (sixth), fair catch rate (sixth), fair catches (T-seventh), punt yards achieved (eighth), and inside the 20 rate (eighth).
Average ranks: returned rate (15th), hangtime (15th), and yards per attempt (18th).
Below average: NET (21st), touchback rate (22nd), and yards per return (23rd), with the coverage units interestingly factoring into each of those metrics.
Bottom five: NONE.
2023 REGULAR SEASON:
Top ten: Return rate (T-second), attempts (seventh), punts inside the 20 (T-seventh), hangtime (ninth), and average yard line (ninth-least).
Average ranks: inside the 20 rate (12th), fair catch rate (T-13th), punts inside the ten (T-14th), yards per return (16th).
Below average: touchback rate (19th), inside the ten rate (23rd), and punts of 50-plus (27th) despite high usage.
Bottom five: 50-plus rate (29th), punt yards achieved (30th), NET (31st), and yards per attempt (32nd) out of 33 qualifiers.
So, we see Harvin was toward the top of the league in many regards to begin 2023, fairing very well as a situational punter, and his lower marks were largely impacted by coverage units and had no bottom-five ranks.
Quite the opposite as the season unfolded. The facets that improved in today’s full-season view were return rate, yards per return, fair catch rate, touchback rate, and hangtime. The flip side was Harvin’s painful downtrends.
Punts inside the 20, and particularly inside the ten, was something he was fantastic at to begin the year, with seven punts inside the 10 the first three games, then matching that total in the remaining 14 games. The worst marks of the season were crucial ones: inside-the-ten rate, 50-plus punts, 50-plus rate, punt yards achieved, NET, and yards per attempt. Ouch.
It will be interesting to see how Pittsburgh presses forward at the position, hopefully turning over every stone possible in the free-agent market and in this year’s rookie class. One thing’s for sure, the Steelers need more consistency at punter in 2024.
Thanks for reading, and let me know your thoughts in the comments.


