The screen game can be an effective tool to keep defenses off balance, a high percentage pass with YAC potential if schemed and executed well. Today I wanted to look at and provide data context for how offensive coordinator (OC) Arthur Smith’s teams have fared in his previous coaching stops (since 2019), along with the Pittsburgh Steelers. The goal is to see what we might expect for the 2024 season.
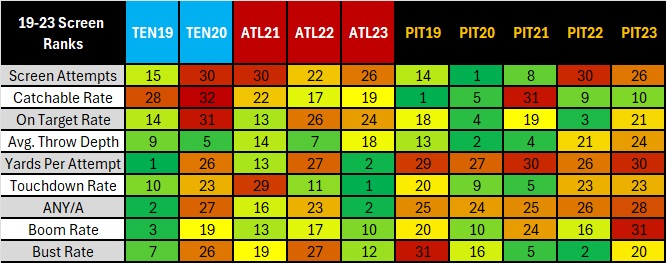
For starters, here is a table of screen attempts and rankings per season via Sports Info Solutions (SIS):
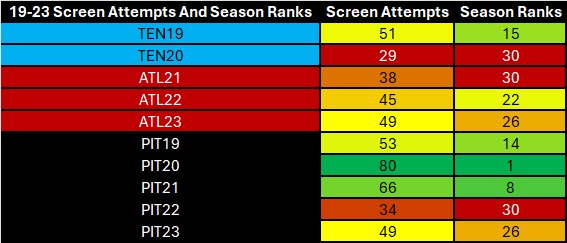
Ironically Pittsburgh and Atlanta, where Smith was the head coach last season, had the same number of screen attempts (49). That tied for 26th across the league in 2023, so not a staple for either team.
Looking at all of Smith’s coaching spots, his first season as OC in Tennessee was his most screen attempts (51), ranking 15th, meaning around the NFL average in 2019. So, in terms of quantity, we see that Smith hasn’t called the scheme often throughout his coaching opportunities.
That is true for Pittsburgh the last two seasons, but ran it much more frequently from 2019-2021. Each of those seasons were above average, particularly 2020 where they had a league leading 80 attempts, along with tying for eighth the following 2021 season.
Those were former Steelers QB Ben Roethlisberger’s final two seasons, and we see a clear plummet of screen attempts following his retirement. The last two seasons, Pittsburgh ranked 30th and 26th with former Steeler Kenny Pickett as the primary QB.
I also wanted recent comparison for Pittsburgh’s new QB room. Russell Wilson had a reputation for throwing short passes often last year with the Broncos. In terms of screens, that number came in at 61, far more than Smith or the Steelers in 2023, but was around average across the NFL (T-16th).
Justin Fields and Chicago actually had more (70), ranking eighth-most. The most attempts in 2023 came from the Super Bowl winning Chiefs at 99, which happened to be second-most in the five-year span. All interesting and important quantity context as we continue.
Next, here are catchable and on target catch rates:
- Catchable%:The percentage of pass attempts that were deemed catchable, excluding spikes, throwaways, and miscommunications and including defensed accurate passes.
- On-Tgt%: The number of on-target/catchable throws a quarterback makes divided by the total number of pass attempts. Does not include plays with no reasonable accuracy expectation such as: spikes, throwaways, QB/WR miscommunications, receiver slips, and passes batted at the line of scrimmage.
Pittsburgh had the only above average marks around the league in both data points since 2019. 2020 was the best balance of both, with a 98.7 catchable rate that was fifth-best that season, and 16th out of the 160 qualifying teams. They paired that with a 97.5 on target rate that ranked fourth, and eighth in the five-year span with Roethlisberger.
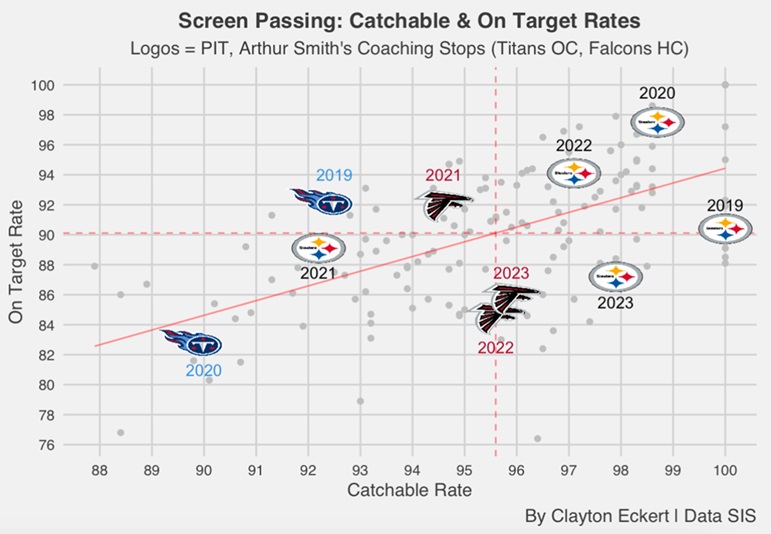
2022 was the other year the Steelers were comfortably above average in both, with a 97.1 catchable rate that tied for ninth, but 51st in the entire timeframe. Their 94.1 on target rate ranked fourth and tied for 31st in the span in Pickett’s rookie year.
Surprisingly in 2019, 100 percent of screen passes were deemed catchable despite an injury riddled season at quarterback. We do see their 90.4 on target rate was much more average though, ranking 18th that season and 79th over the five-year sample.
Most recently, the 2023 Steelers had an above average 97.9 catchable rate that tied for tenth that year, and tied for 36th the last five seasons. The issue was a downtrend in on target rate (87.2), which ranked 120th among qualifiers.
The only season Pittsburgh was below average in both data points was 2021 (Roethlisberger’s final season). That season, their 92.2 catchable rate ranked 31st, while an 89.1 on target rate landed tied for 19th.
So, there were some better moments then I anticipated for Pittsburgh in these terms, but accuracy took a notable hit for both Roethlisberger and Pickett in their final seasons with the team.
Unfortunately, none of Smith’s former teams had inspiring numbers, with none of them landing on the top right of the chart.
Starting with his time as OC in Tennessee, they were well below average in catchable rates in 2019 (92.2) and 2020 (89.7), ranking 28th and dead last each season. The 2019 Titans were above the mean in on target rate (92.2), ranking 14th.
The following 2020 season plummeted to 82.8 though, one of the worst teams at 31st that year and 153rd (out of 160) in the span. For all the strengths those offenses had, we can clearly see the screen game didn’t drive that ship.
Things were a bit better in Atlanta overall. In 2021, they posted a 94.6 catchable rate that ranked 22nd, along with a stronger 13th season ranking in target rate (91.9). The last two seasons were very similar numbers for the Falcons despite big changes, particularly at QB, which was actually true for all three years Smith was the head coach.
In 2022, the Falcons had a 95.6 catchable rate that tied for 17th, while their 84.4 on target rate tied for 26th. Last season, both were slightly better numbers: 95.9 catchable rate and 85.7 on target rate, ranking 19th and 24th.
So far, QBs accuracy on screens has lacked under Smith, and some better-than-expected results for Pittsburgh.
Now let’s examine the average throw depths and yards per attempt:
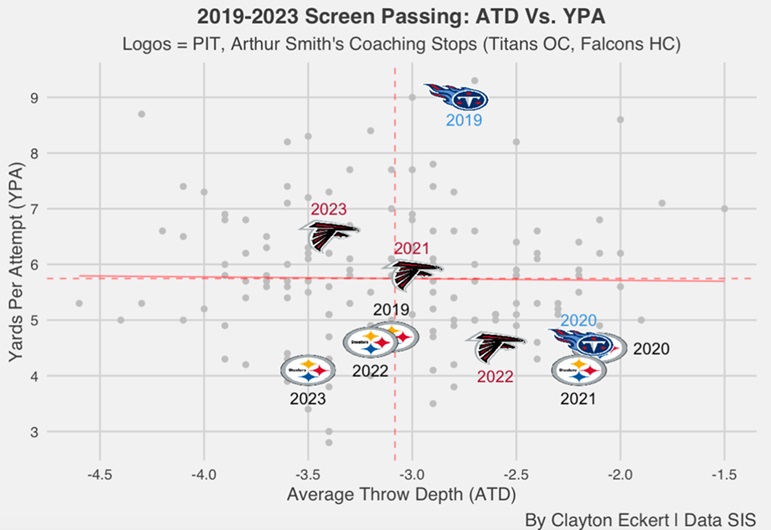
Wow. What jumps out first in my opinion are Pittsburgh’s well below average yards per attempt in each of the last five seasons. Quite excruciatingly, 2019 was their best season in that regard with reserve QBs for much of the season. The visual also paints a fuller picture to their stronger accuracy rates in the previous view, and poorer outcomes of plays overall.
Here’s yards per attempt for each Steelers team, and their ranks in the five-year span (160 qualifiers):
Steelers YPA:
2019: 4.7 YPA, T-128th.
2020: 4.5 YPA, T-138th.
2021: 4.1 YPA, T-149th.
2022: 4.6 YPA, T-135th.
2023: 4.1 YPA, T-149th.
Whoof.
While all qualifying teams had negative average throw depths as expected, we see 2020-2021 were above average for Pittsburgh. In 2020, that number came in at -2.1 yards, which tied for second-closest to the line of scrimmage that year, and tied for seventh in the span. 2021 was close behind, with a -2.2 ATD (season: fourth, span: T-11th). Unfortunately, that didn’t equate to more total yardage, and we see no correlation to that across the NFL.
Smith had better yardage results in previous coaching stops, but lacked consistency. His first 2019 season as Titans OC featured his best 9.0 YPA result, ranking first that season and second in the time frame, encouragingly. Great to see on his resume, but that was five years ago.
The following 2020 season fell off a cliff, landing in the pits with Pittsburgh at a 4.6 YPA number (T-135th). The 2022 Falcons were also just behind at 4.5 YPA, tying for 138th. Smith’s other two seasons as head coach there saw above average YPA on screens, encouragingly.
Smith YPA:
2019: 9.0 YPA, second.
2020: 4.6 YPA, T-135th.
2021: 5.8 YPA, T-67th.
2022: 4.5 YPA, T-138th.
2023: 6.5 YPA, T-38th.
Up and down to say the least, but high marks on his resume and a positive trend last season is encouraging, and will hopefully improve for the 2024 Steelers.
Here are touchdown rates, along with Adjusted Net Yards per Attempt (ANY/A = ([Pass Yards] + 20[Pass TD] – 45[Interceptions] – [Sack Yards])/([Attempts] + [Sacks]).):
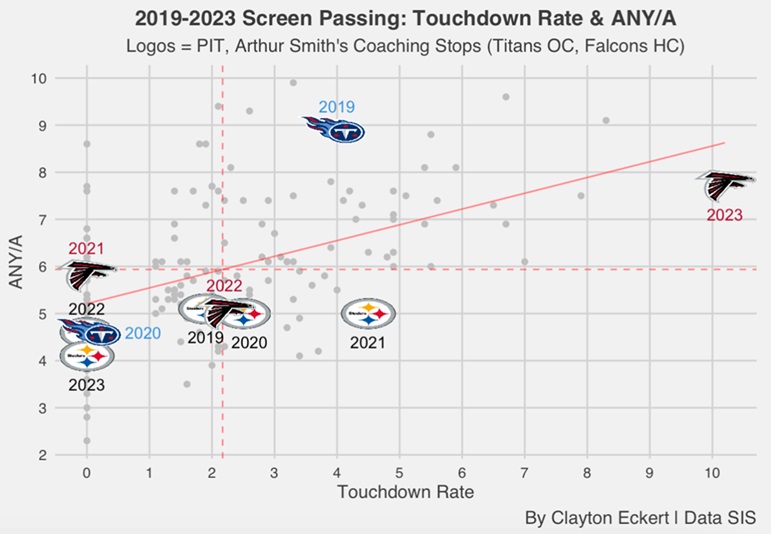
As you can see, Pittsburgh has thoroughly struggled here as well. The Steelers have had a below average ANY/A on screens each of the last five seasons as well:
Steelers/Smith ANY/A:
2019 – Pittsburgh: 5.1 ANY/A, T-112th. Smith: 8.9 ANY/A, sixth.
2020 – Pittsburgh: 5.0 ANY/A, T-117th. Smith: 4.6 ANY/A, T-135th.
2021 – Pittsburgh: 5.0 ANY/A, T-117th. Smith: 5.8 ANY/A, T-77th.
2022 – Pittsburgh: 4.6 ANY/A, T-135th. Smith: 5.0 ANY/A, T-117th.
2023 – Pittsburgh: 4.1 ANY/A, T-150th. Smith: 7.7 ANY/A, T-15th.
Pittsburgh ranked in the hundreds each season, while Smith landed in the top 15 in 2019 and last season in 2023, encouragingly.
Scoring is the ultimate goal to winning of course, and we see that Pittsburgh had a couple above average seasons (2020 and 2021). More recently though, they have failed to score a touchdown on a screen each of the last two seasons:
Steelers TD Rates:
2019: 1.9-percent, T-78th.
2020: 2.5-percent, T-58th.
2021: 4.5-percent, T-22nd.
2022: none.
2023: none.
So, Roethlisberger’s final 2021 season was Pittsburgh’s best result in the timeframe. Looking at the receiving end of things, TE Pat Freiermuth interestingly led all Steelers receivers in per season screen touchdowns with two that year, and Pittsburgh’s only player with multiple. Here are Steelers who had screen touchdowns:
Steelers Receivers with Screen TDs:
2019: TE Vance McDonald (one).
2020: WR Chase Claypool (one). TE Eric Ebron (one).
2021: TE Pat Freiermuth (two). TE Eric Ebron (one).
2022: none.
2023: none.
Other than no TDs the last two years, seeing the breakdown by position is rather interesting. Four TDs from tight ends, just one WR screen touchdown, and none from the RB position. Hopefully we see more of that considering the talent Pittsburgh has in the backfield, along with getting TEs back on the board in 2024.
The latter sounds up Smith’s alley, loving the usage of tight ends. Here are TD rates and receiver splits for his teams:
Smith’s TD Rates/Receivers with Screen TDs:
2019: 3.9-percent, T-30th, RB Derrick Henry (two).
2020: none.
2021: none.
2022: 2.2-percent, T-64th, RB Tyler Allgeier (one).
2023: 10.2-percent, first, RB Bijan Robinson (two). TE Jonnu Smith (one). RB Tyler Allgeier (one). RB Cordarrelle Patterson (one).
Surprisingly, just one TE screen went for a TD the past five years under Smith. An encouraging side of the coin though is RB production, with seven from the position in the span compared to none for Pittsburgh, which he can hopefully bring with him to the black and gold. Also, seeing five of those touchdowns came last year, including a new Steeler in Patterson.
Most importantly, Atlanta’s 10.2 TD rate ranked first in the five-year span, bringing recent optimism for 2024.
To close, here is a season rankings table of all the data I compiled for the study:
Thanks for reading and let me know your thoughts in the comments.