Accuracy is obviously an important element for an effective offense in today’s NFL. Adjusted completion percentage attempts to measure that, and I wanted to look at that stat courtesy of Pro Football Focus (PFF).
PFF describes adjusted completion percentage as accounting for elements that hurt the passer’s completion percentage, but don’t show how accurate they are. These factors are dropped passes, throw aways, spiked balls, batted passes, and passes where the QB was hit while they threw the ball.
Here’s the formula: ((Completions + Drops) / (Attempts – Throw Aways – Spikes – Batted Passes – Hit As Thrown)).
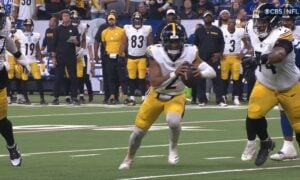
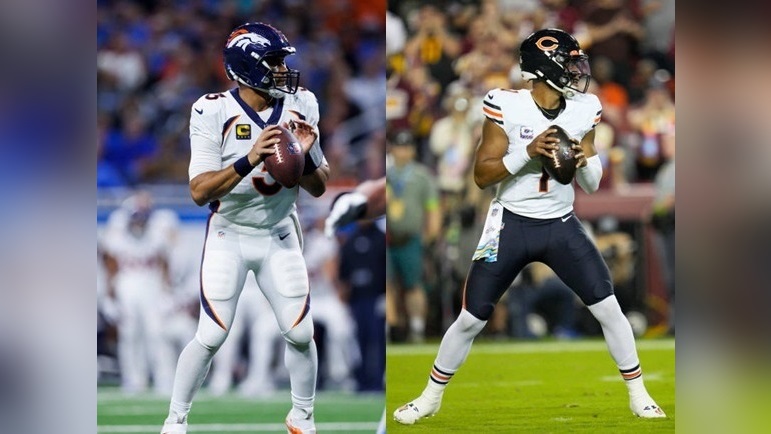
Today, I wanted to see what new Steelers quarterbacks Russell Wilson and Justin Fields were able to provide for their squads in these terms in 2023.
Let’s see how quarterbacks with a minimum of 300 regular season dropbacks fared in adjusted completion percentage, along with the more publicly used completion rates:
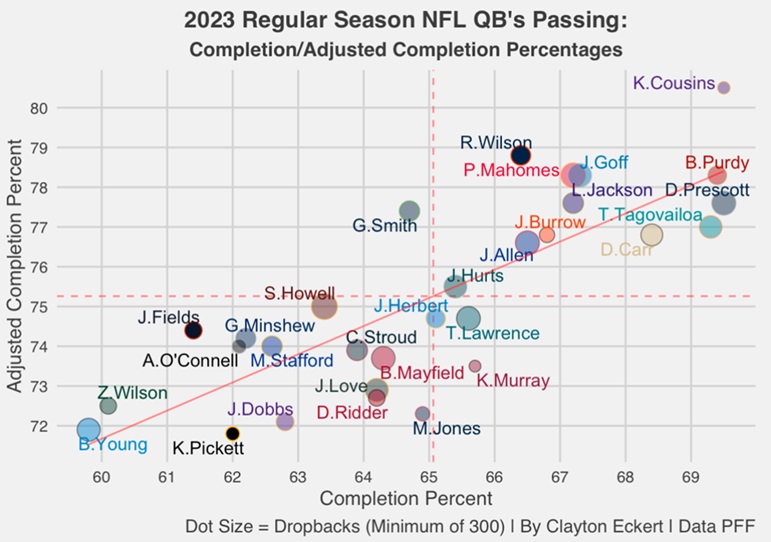
Very telling visual through Steelers’ lenses. We clearly see that Wilson provided the strongest numbers by far, comfortably above average in both data points. Starting with the more publicly referenced completion percentage, Wilson posted a 66.4 number in 2023, ranking 11th out of the 30 qualifying quarterbacks. Not bad on surface level.
Then looking at adjusted completion rates, we encouragingly see Wilson rocket up to second-best in the NFL, at 78.8-percent. While many have discussed it being a down year for him, this adjusted data really points to Wilson being very accurate on expected passes.
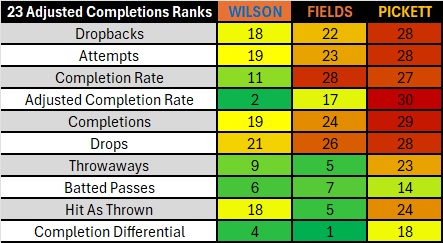
Diving deeper, Wilson had 297 completions in 2023 (T-19th) on 530 dropbacks (18th). On the receiving end, 18 passes were dropped, tying for 21st. For context, four QBs tied for the most drops by their receivers (29): Matthew Stafford, Dak Prescott, Patrick Mahomes, and Jared Goff. Interesting list of names, considering the success of those teams overall in 2023, and we see drops weren’t the reason for Wilson’s stronger adjusted completion rate.
On Wilson’s 447 pass attempts (19th), he had 27 throwaways (T-ninth most), 11 batted passes (sixth-most), and hit on throws five times (T-18th). So, we see the bats effected his adjusted completion rate the most. Two sides of the coin, the positive showing Wilson’s encouraging accuracy when expected to do so, but an unsurprising issue that could continue in 2024 given his lack of height and defenders able to disrupt his passing lanes.
Sometimes throwaways are the correct decision when a play breaks down, and Wilson’s high ranking in that regard also jumps out, with him ‘living to see another down,’ as they say.
Considering the findings in my recent Performance Under Pressure study, I expected Wilson’s hit as thrown number to be much higher as the fourth-most sacked QB in 2023. This points to a downside to his extending the play ability, taking far too many sacks. Hopefully that’s a more digestible number with the black and gold in 2024.
On the chart above, we get great visual context to which quarterbacks saw the biggest leap from their completion rates, compared to adjusted completion percentages by seeing how far above the trendline (diagonal line) they land. Wilson was definitely one of those quarterbacks.
Here is a visual of QB completion differentials (adjusted completion rate – completion percent) to further this point:
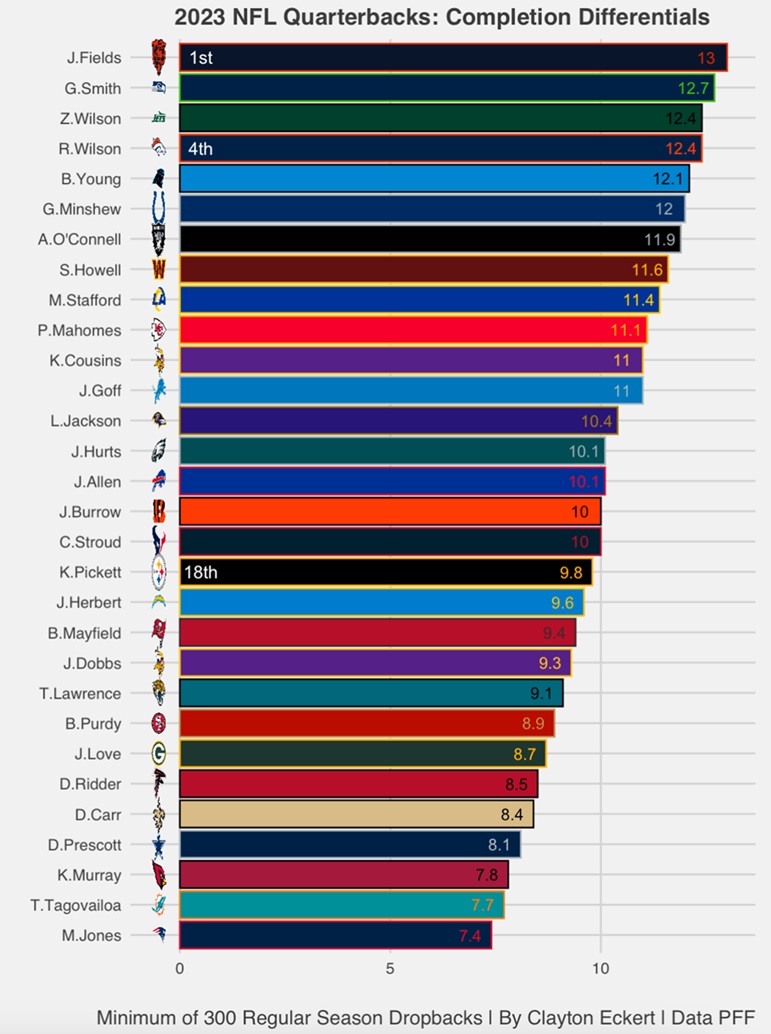
Here we see the new Steelers quarterbacks both landed in the top five in completion differentials, encouragingly. While Wilson’s dot landed best on the opening chart, he had the fourth-best differential. Justin Fields boasts the top-ranked completion differential of the qualifying QBs 2023.
This came on 457 dropbacks (22nd), with a 61.4 completion percentage that ranked third-worst (28th), along with a 74.4 adjusted completion rate that jumped all the way to a much better 17th. More specifically, Fields had 227 completions (24th), 14 drops (T-26th), 370 attempts (23rd), 29 throwaways (T-fifth), ten batted passes (T-seventh), and seven hit as thrown passes (T-fifth most).
So, we see the biggest factors in Fields’ stronger adjusted completion rate were throwaways, bats, and being hit as he threw. Similar trends to Wilson in several ways, including drops not being a primary reason for the stronger adjusted completion rate. One notable exception was Fields being hit as he threw more often.
Let’s compare Wilson and Fields to what we saw transpire with former Steeler Kenny Pickett in 2023. Here are Pickett’s marks: 363 dropbacks (28th), 62.0 completion rate (27th), a dead-last 71.8 adjusted completion rate (30th), 201 completions (29th), 13 drops (T-28th), 324 attempts (28th), 14 throwaways (T-23rd), eight batted passes (T-14th), three hit as thrown passes (T-24th), for a 9.8 completion differential (18th).
This definitely adds context to some poor play from Pickett last season, including bottoming ranks, including both completion and adjusted completion rates. Drops also fell into that category, meaning the receiving end of the passing game was not the primary issue for any of the three quarterbacks in the study.
For Pickett, it was batted passes in particular that improved his adjusted completion number, but the other issues contributed to an unacceptable number that was worst among qualifiers.
To close, here are the adjusted completion percentages for 2023, conclusion, and a wrap up table of today’s data:
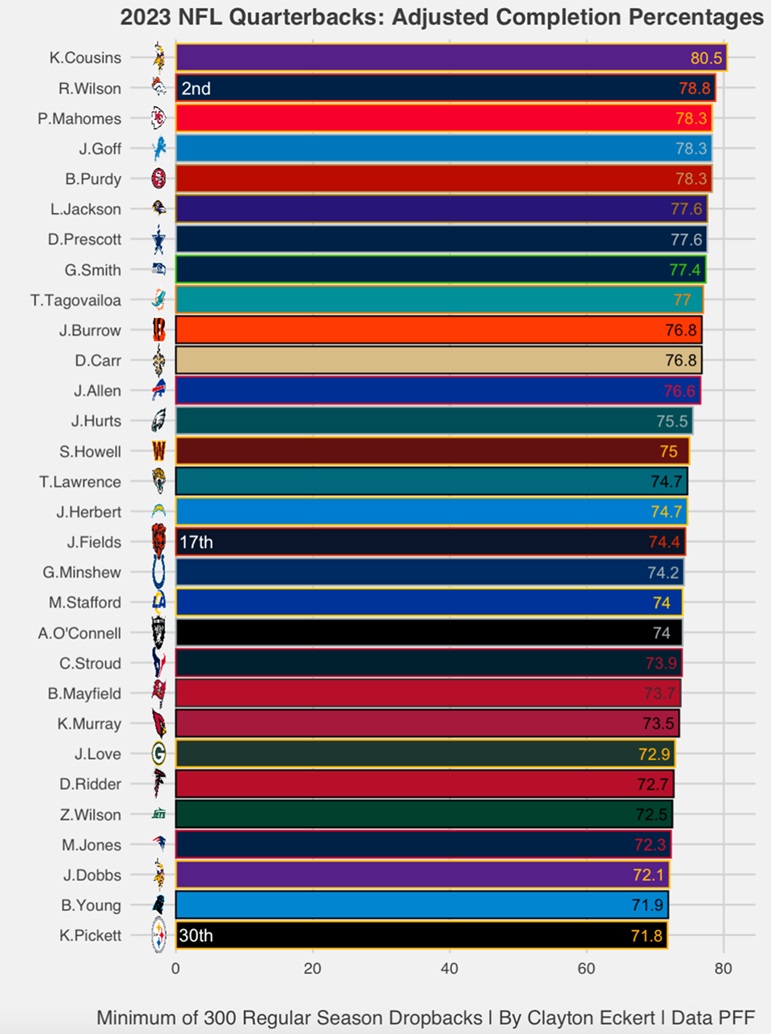
First, seeing Pickett land at the bottom of the barrel furthers my recent points and is part of the equation of Pittsburgh moving on. Then, we see Wilson at the other end of the spectrum in a positive way, with the second-best adjusted completion rate. Fields lands close to the middle of the pack, ranking 17th. Wilson and Fields made healthy jumps from completion percentage compared to their adjusted numbers, encouragingly.
So, with the goal of adjusted completion percentage, we see the top accuracy on expected passes came from Wilson. We also see some justifiable reasons as to why Wilson was given ‘pole position’ to be Pittsburgh’s QB1. Fields was just below league average, but had the top-ranked completion differential, emphasizing his stronger results on passes he was expected to produce on.
Though their respective teams didn’t fare well in 2023, we also get more context as to why and see some encouraging data in terms of quarterback play overcoming that in several ways, which will hopefully carry over into 2024.
Pickett’s results (worst in nearly every data point) reemphasizes how much and how needed a positive trend at the position is for the black and gold. Here’s to hoping the revamped room provides that impact this season.