The Pittsburgh Steelers continue to add to the roster in free agency, with the addition of safety DeShon Elliott, the former Miami Dolphin. So, I wanted to look at and provide data of his 2023 season, starting with coverage, and including Pittsburgh safeties for comparative context using data from Sports Info Solutions (SIS).
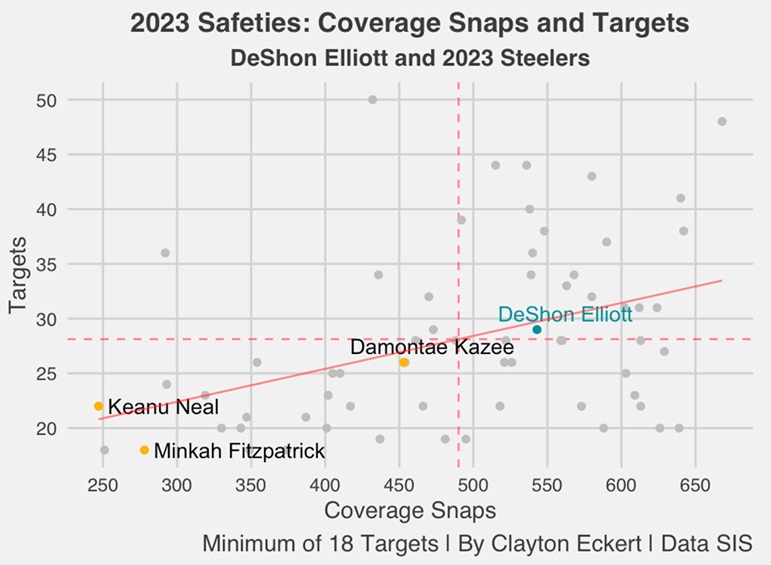
Let’s get right to it, starting with 2023 coverage snaps and targets to get a gauge of the quantity of plays comparatively:
Elliott had the most coverage snaps (543) of focused players which ranked 24th out of 64 qualifying safeties last season and was targeted 29 times (T-23rd). A common theme in Pittsburgh’s offseason additions on defense has been ample snap counts last season. That’s understandable at the positions they have addressed, considering the decimation of the linebacker and safety rooms in 2023. The visual emphasizes this point, seeing all Steelers safeties on the bottom left.
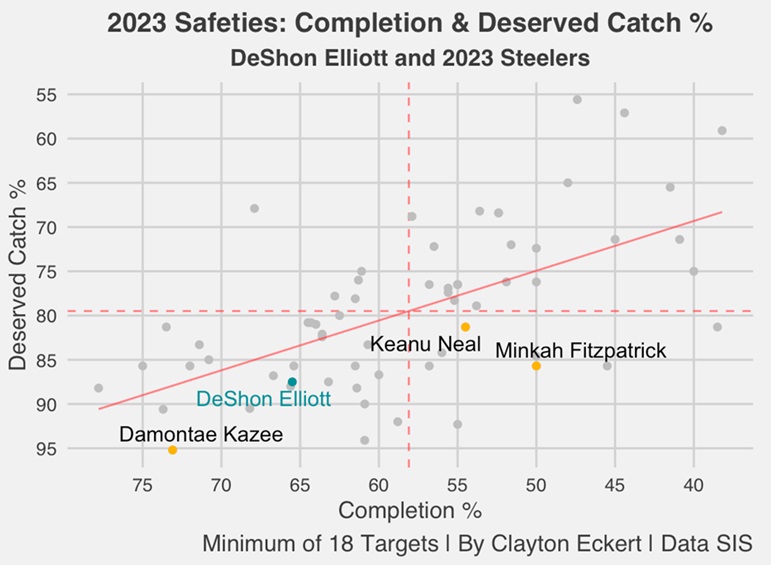
Now let’s begin to examine the quality of play with completion percentage and deserved catch percentage, which is the number of completions and drops divided by the number of catchable targets and passes defensed:
A below-average part of Elliott’s 2023 campaign came in this regard. His 65.5 completion percentage allowed ranked 52nd league-wide and had an 87.5 deserved catch rate that tied for 53rd.
In comparison, Pittsburgh safeties Minkah Fitzpatrick and Keanu Neal had above the mean completion rates allowed (T-11th, 21st), and their deserved catch percentages topped Elliott but were below average league-wide (T-44th, T-34th). Neal was released this offseason with a failed physical designation.
Damontae Kazee is still under contract but had the lowest numbers of the group in each, ranking 60th, and dead last in deserved catch rate (95.2-percent). This points to another element of the needed addition at the position that hopefully pans out well in 2024 with Elliott (and possibly others).
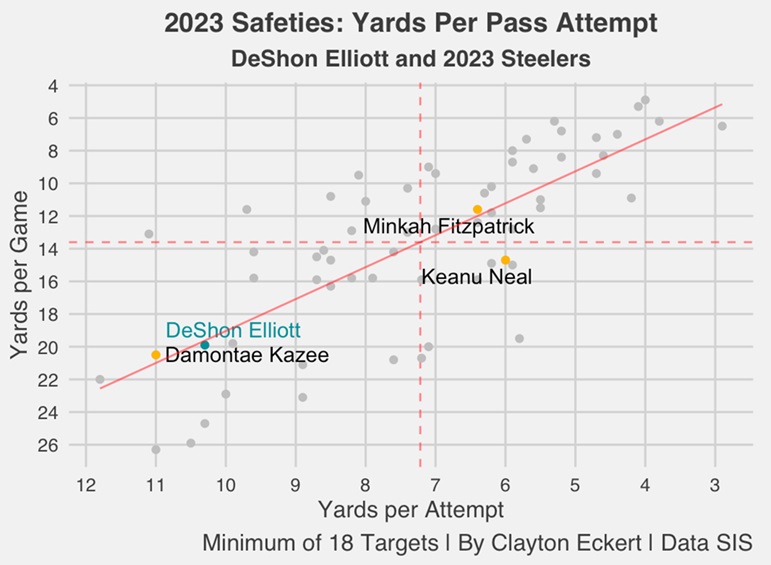
Next, let’s look at the yardage of the targets with yards per attempt and yards per game:
Again, not ideal for Elliott in 2023. Well below the mean in each, with 10.3 yards per attempt (T-58th) and 19.9 per game (53rd). This landed close to Kazee (T-61st, 55th), who didn’t have a great season in coverage to say the least (more on this to come). Fitzpatrick was above average in each, while Neal did so among his peers in yards per attempt.
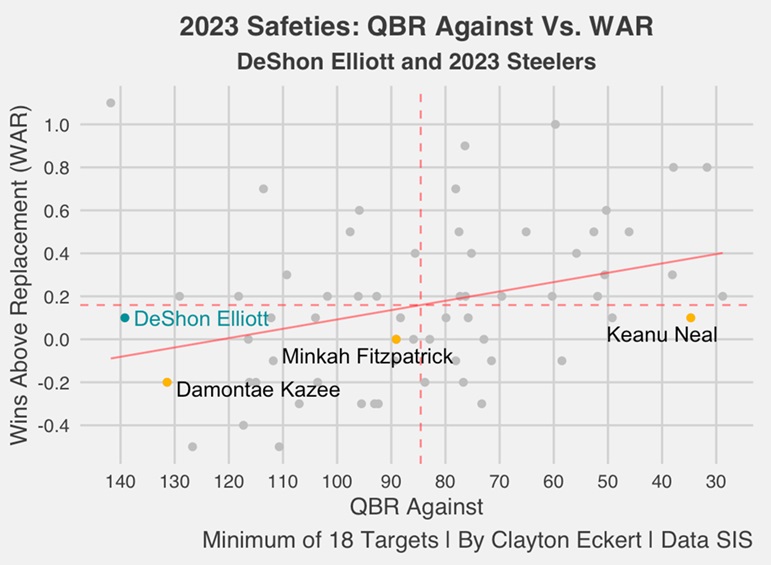
Another stat that is used often to evaluate defenders in coverage is QBR Against (factors in completions, yards, touchdowns, and interceptions), so let’s see how they fare along with Wins Above Replacement (WAR) which is a points above replacement scale conversion that is based on the scoring environment:
Elliott tied for the best WAR ranking among highlighted players (32nd), but we can see the entire group was below the mean in these terms. A worrisome finding was his bad 139.2 QBR against, which was next-to-last among qualifying safeties.
This included four touchdowns allowed (T-third worst). He did have an interception, and a notable seven passes defensed (T-fourth most). For context, the three Steelers safeties combined for four touchdowns allowed, three interceptions, and four passes defensed.
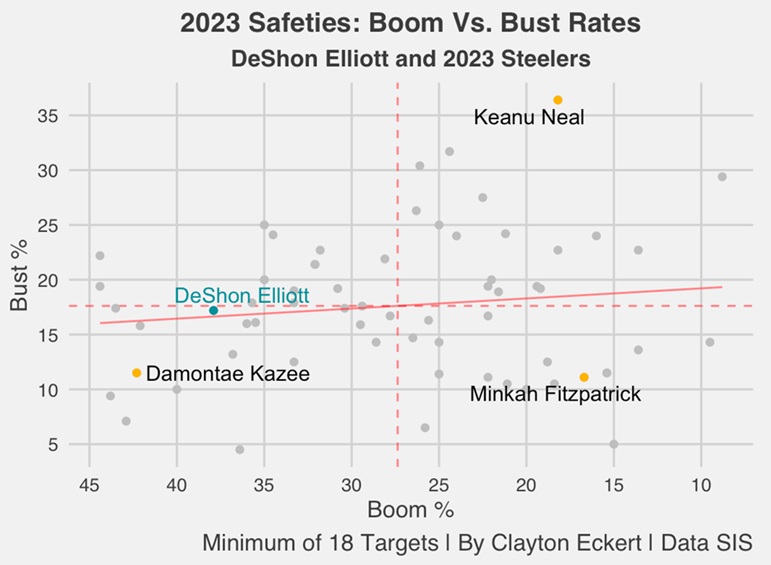
To close, let’s look at SIS’s Boom and Bust percentages to see the rates of big plays allowed or made in coverage.
- Boom % = The percentage of dropbacks that resulted in an EPA of 1 or more (a very successful play for the offense)
- Bust % = The percentage of dropbacks that resulted in an EPA of -1 of less (a very unsuccessful play for the offense)
Bust rate was the stronger one for Elliott in 2023 (17.2), which ranked 34th league-wide. His 37.9 boom rate allowed was the unfortunate fact, ranking 56th. Definitely makes sense after the previous view.
Unexpectedly, Neal had the top ranked 36.4 bust rate last season, and only focused player to land above the mean in each. Fitzpatrick’s best mark was a well-above-average boom rate, but poor bust percentage compared to what we expect from the all-pro talent. Kazee lands below the mean in each, a common theme for him throughout the entire article.
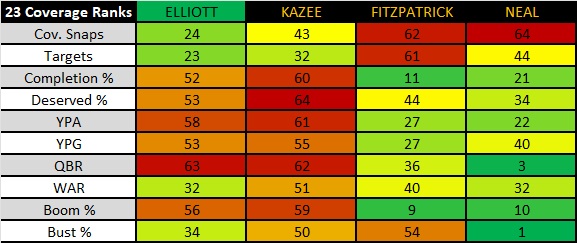
So, here is a wrap up table of the data and conclusion:
Where Elliott fared best was availability, with top-25 ranks in coverage snaps, and targets. WAR and bust rate were close behind, around league average among his peers at safety last season. The rest of the data was well below average: completion rate allowed, deserved catch rate allowed, yards per game, boom rate, yards per attempt, and next-to-last in QBR against.
Hopefully, Elliott can have a stronger 2024 in coverage for Pittsburgh. The strong safety role he was brought in to fill, and being available and able to stay on the field for the majority of snaps are very attractive. I can’t wait to see how it all pans out. Stay tuned for more studies coming soon.

