Today I wanted to provide the other side of the coin to my weekly Steelers’ Quarterback Passing Chart articles, looking at and providing takeaways for Pittsburgh’s receivers through Week 14.
Couple notes before we jump in. Thanks to Thomas Mock for his great work that helped me learn much of what I’m using in the series visually. Spikes and clear throwaways are removed due to being the correct situational decision, along with batted passes at the line of scrimmage that effect the intended pass location.
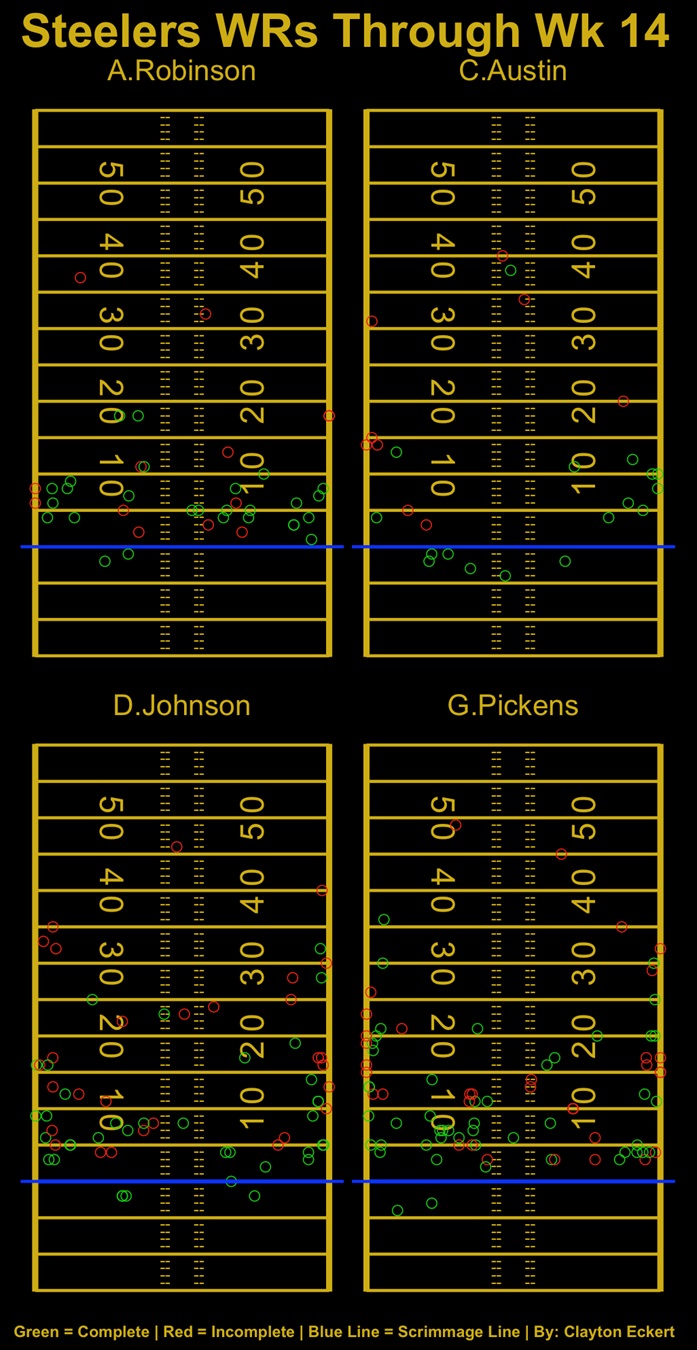
First, let’s look at the top four wide receivers’ completion/incompletion dots, then discuss targets, catches, and catch rates along with team ranks (eight qualifiers, min. 25 targets):
George Pickens-Charted-Targets: 83 (first). Catches: 49 (first). Catch-Rate: 59 percent (seventh).
Pickens still leads the team in targets and catches, while being next-to-last in catch-rate. While none of the receivers have stellar results in the explosive-play-department, Pickens accounts nearly half of the WRs explosive completions (ten), in an underwhelming 2023 offense that’s lacked connection, particularly at that distance.
Diontae Johnson-Charted-Targets: 66 (second). Catches: 37 (third). Catch-Rate: 56.1 percent (last).
Johnson is now second on the team in targets, returning from injury following the Week-Six-bye, third in catches, but dead last in catch rate. Not what you want to hear regarding the teams best route runner, and seeing his dots really highlights this discouraging fact that I will dive into deeper in a bit.
Allen Robinson II-Charted-Targets: 40 (fourth). Catches: 27 (fourth). Catch-Rate: 67.5 percent (fourth).
Ranking fourth in each, Robinson has been a reliable short-area-receiver in 2023, filling that role nicely for Pittsburgh. We do see from the dots eight incompletions have come on between the numbers, compared to four outside of them.
Calvin Austin III-Charted-Targets: 26 (last). Catches: 17 (last). Catch-Rate: 65.4 percent (sixth).
Opportunities have dwindled upon Johnson’s return, now last among qualifiers in targets and catches. Short catch rates have been good overall, particularly behind the line and to the right side of the field. Deep connection issues bring his overall catch rate down to sixth on the team.
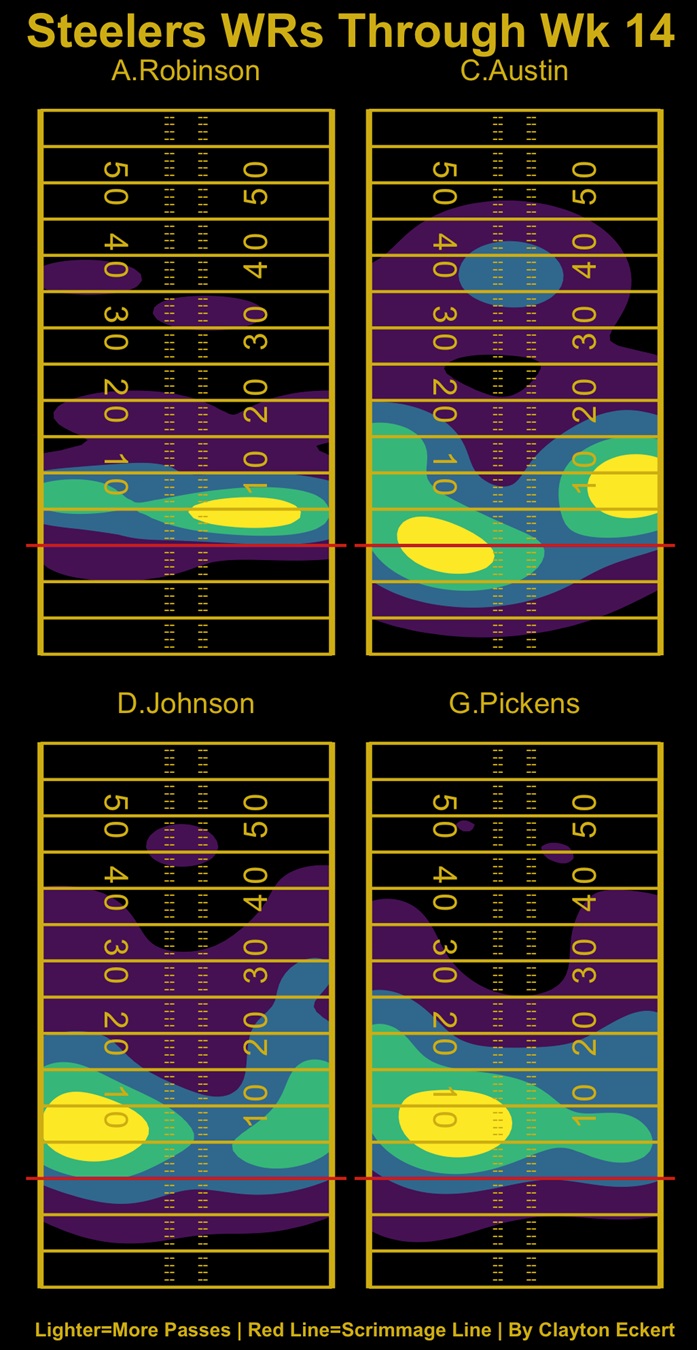
Here are heat maps of all targets, then completion rates by pass distance:
Pickens-Behind-the-line: 2/2 (100-percent). 0-5 air yards: 14/21 (66.7 percent). 5-10 air yards: 17/22 (77.3 percent). 10-15 air yards: 7/19 (36.8 percent). 15-20 air yards: 8/17 (47.1 percent). Explosive: 10/19 (52.6 percent).
Most-frequent has been 0-10 air yards, with each distance eclipsing 20 targets, and his highest catch rate at 5-10 air yards. What stands out most positively is his team-leading explosive catch rate on the highest volume. Intermediate targets have been a struggle for Pittsburgh, and Pickens has the lowest catch rate among Steelers WRs at 10-15 air yards.
Johnson-Behind-the-line: 4/4 (100-percent). 0-5 air yards: 12/16 (75-percent). 5-10 air yards: 13/20 (65-percent). 10-15 air yards: 4/9 (44.4 percent). 15-20 air yards: 4/9 (44.4 percent). Explosive: 4/15 (26.7-percent).
Johnson’s catch rates decrease at each pass distance, and ties for the highest catch rate among Pittsburgh-WRs at 0-5 air-yards. Rough explosive results, at the second-most-targets. Down the stretch, Pittsburgh would be wise to shift opportunities to Pickens and work Johnson more in the short/intermediate areas of the field overall.
Robinson-Behind-the-line: 2/2 (100 percent). 0-5 air yards: 12/16 (75 percent). 5-10 air yards: 14/18 (77.8 percent). 10-15 air yards: 2/4 (50 percent). 15-20 air yards: 2/4 (50 percent). Explosive: 0/2 (0 percent).
Robinson ties-or-leads in catch rates at ten air yards or less, and not utilized much on intermediates/explosives. Neither are surprising, and would expect that important role to continue. Would like to see him targeted more on short-money-downs, where Pittsburgh has struggled.
Austin-Behind-the-line: 6/6 (100 percent). 0-5 air yards: 3/5 (60 percent). 5-10 air yards: 5/6 (83.3 percent). 10-15 air yards: 5/8 (62.5 percent). 15-20 air yards: 0/2 (0 percent). Explosive: 1/5 (20 percent).
Austin leads WRs in behind-the-line targets, where the group has perfect catch rates. His usage has been sparse since Johnson’s-return, with only six targets the last eight games. Leads the group with an 80-plus catch rate at 5-10 air yards (low targets), and past 15 yards hasn’t gone well overall, unfortunately (14.3 percent).
NOTE: Austin’s heat maps are generously wide, considering his low number of targets comparatively.
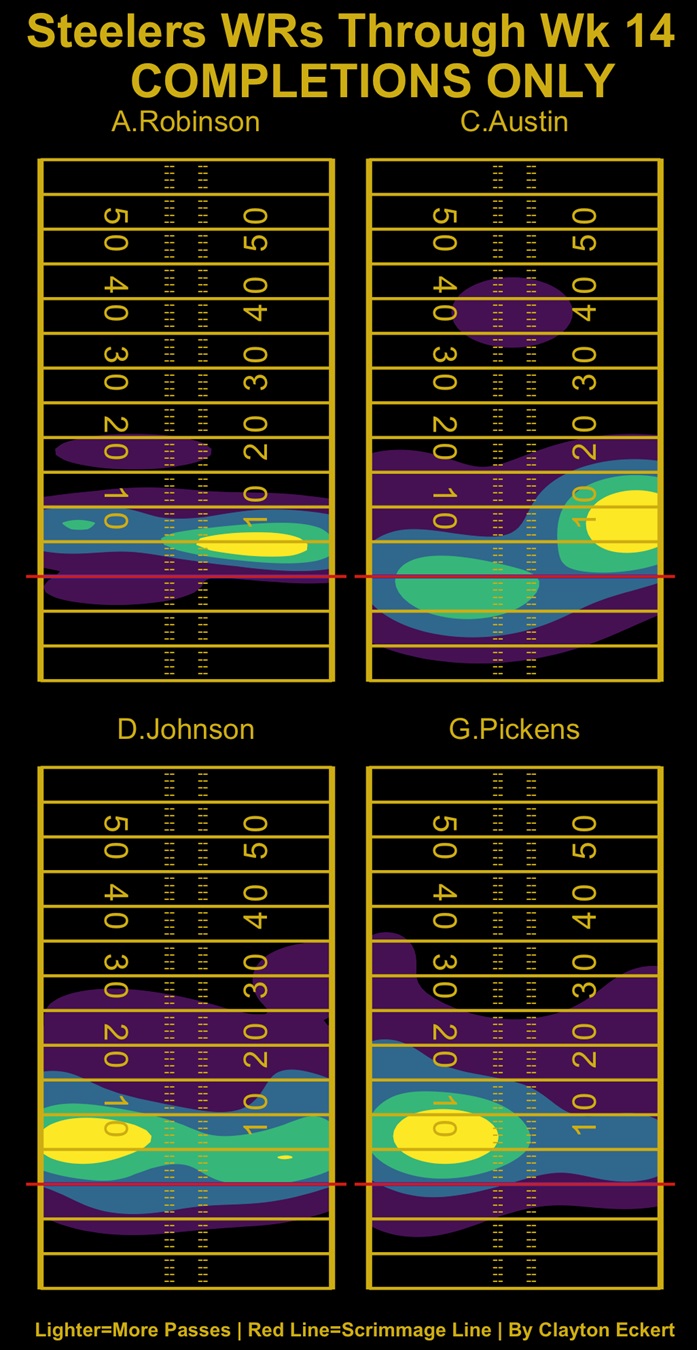
Here’s the completions only heat map:
The last point is important when viewing the completions-only chart. Austin’s triple-explosive touchdown in Week Three is still the longest-completed-air-distance for Pittsburgh this season (38 air yards). Hoping for a new long, Pickens in particular, coming of a frustrating game of short area utilization and just 19 yards (six targets).
Pickens has three 30-plus air-yard-completions, two since Week 12, and the other his Week-Five-touchdown. Johnson has only one such completion, also in Week 12, and two other explosive catches since Week 13, including last game touchdown (only meaningful explosive play of the outing). Their more recent connection is great, and hopefully, that continues in a quality-over-quantity approach as I suggested earlier.
Pickens most targeted area: middle-left to outside-the-numbers at 3-13 air-yards. Most completed area: left-hash to left-outside-the-numbers at 3-11 air-yards.
Johnson most-targeted area: outside-left-hash to left-sideline at three-12 air-yards. Most completed area: outside-left-hash to left-sideline at 3-9 air yards.
Robinson most-targeted area: right-hash to outside right numbers at 3-7 air yards. Most completed area: right-hash to outside-right-numbers at 3-6 air yards.
Austin-Most-targeted-area: left-hash to outside-left-numbers behind-the-line to six-air-yards, and right-numbers to right-sideline at 4-13 air-yards. Most completed area: right-numbers to right-sideline at 4-13 air-yards.
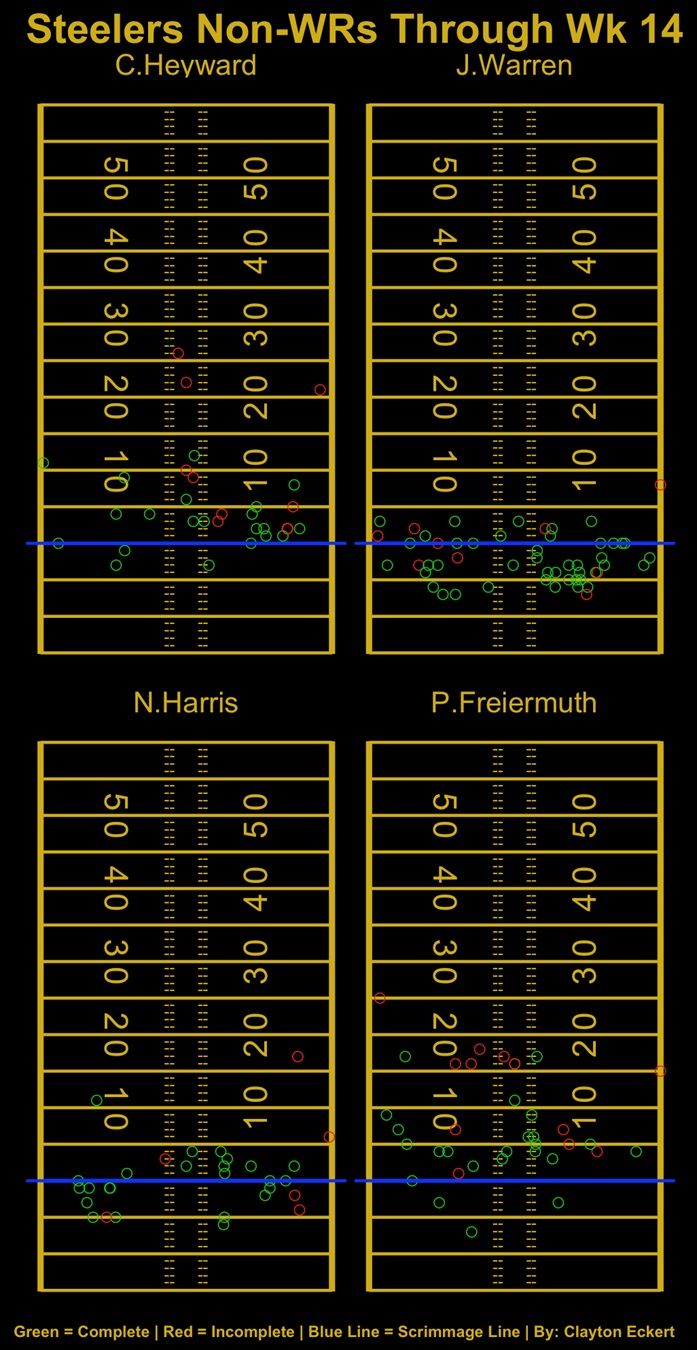
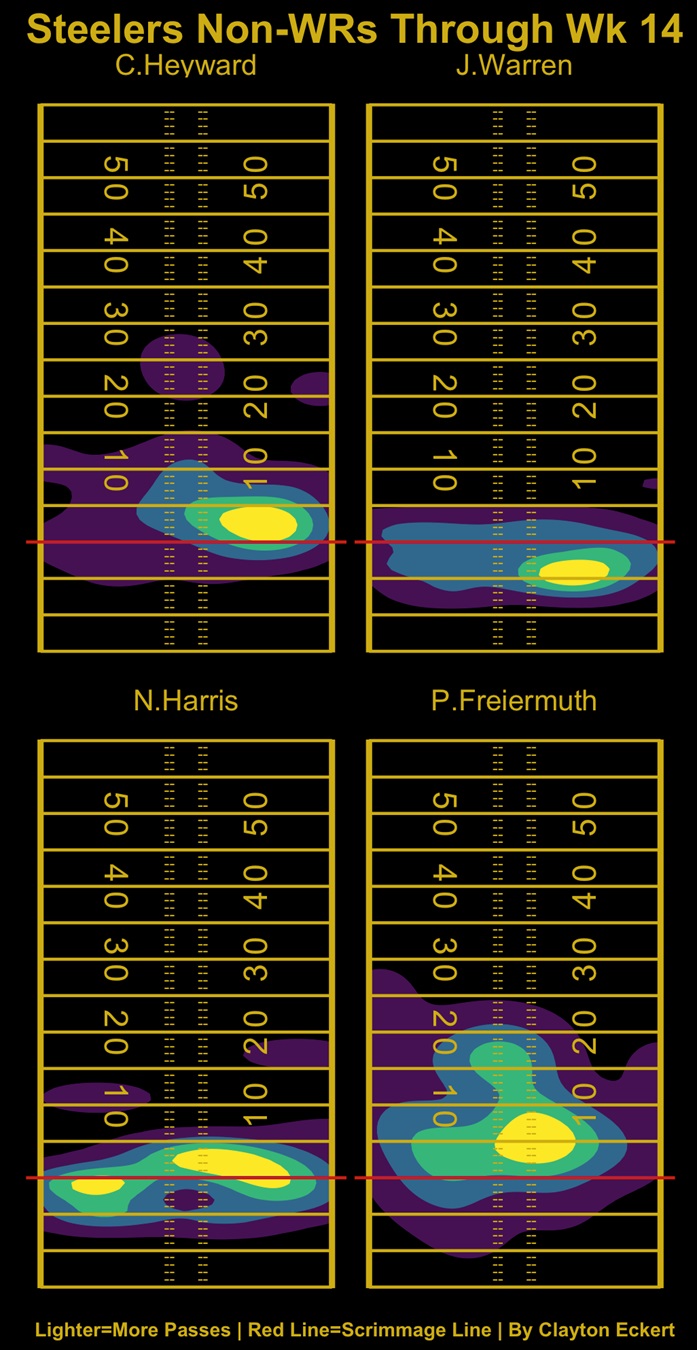
Now for non-WRs, starting with dots and team ranks (eight qualifiers, min. 25-targets):
RB Jaylen Warren: Charted-Targets: 52 (third). Catches: 43 (second). Catch-Rate: 82.7 percent (first).
Warren has seen his 2023 role blossom, second on the team in catches, third in targets, and the best catch rate among Pittsburgh’s qualifying pass-catchers. Some of this is due to injury, but mostly being one of the most consistent performers for Pittsburgh’s-offense in 2023.
TE Pat Freiermuth: Charted-Targets: 36 (fifth). Catches: 24 (T-fifth). Catch-Rate: 66.7 percent (fifth).
Fifth across the board, it’s been a disappointing season for Freiermuth in totality. Even when healthy (missed five games), he hasn’t involved nearly enough, and his catch rate is also sub-par. Much of that is inconsistent QB play, but he’s let opportunities slip through his grasp as well, including last game on an over-the-middle intermediate target in the fourth quarter of the painful loss.
TE Connor Heyward: Charted-Targets: 31 (sixth). Catches: 21 (seventh). Catch-Rate: 67.7 percent (third).
A positive for Heyward is being third on the team in catch-rate, but we can see it’s only one percent higher than Freiermuth’s fifth rank. He has made some encouraging plays this season, including the teams only third-down-passing conversion last week, and can hopefully continue to sprinkle in impactful plays with the receiving corps healthy (knocks-on-wood).
RB Najee Harris: Charted-Targets: 30 (seventh). Catches: 24 (T-fifth). Catch-Rate: 80 percent (second).
Harris’ role has diminished severely upon Warren’s-emergence, seventh on the team in targets, compared to fourth in 2022. As expected, the RBs lead the receivers in catch rate with Harris ranking second, on 24 catches ties Freiermuth at fifth on the team to date.
Now heat maps for all charted targets and completion rates by pass distance:
Warren-Behind-the-line: 28/32 (87.5-percent). 0-5 air yards: 18/22 (81.8 percent). 5-10 air yards: 0/1 (0 percent). 10-15 air yards: 0/0. 15-20 air yards: 0/0. Explosive: 0/0.
Warren’s longest completion is at three air yards, highlighting the check-down nature and highly efficient targets overall. He is one of only 12 NFL RBs with 50 targets, and thankfully YAC has been a strong suit, averaging 8.9 per reception which ties for fourth among that list.
Freiermuth-Behind-the-line: 3/3 (100 percent). 0-5 air yards: 12/15 (80 percent). 5-10 air yards: 8/11 (72.7 percent). 10-15 air yards: 1/2 (50 percent). 15-20 air yards: 3/9 (33.3 percent). Explosive: 0/1 (0 percent).
We also see Freiermuth has an efficient catch rate at ten air yards or less, but unfortunately a different story in the intermediate/explosive distances. Frustrating lack of presence in the middle of the field much of 2023, but saw a glimpse of that his breakout game in Week 12.
Trubisky did target him three times on intermediate passes over the middle last week, an encouraging development considering how little Pittsburgh has utilized that part of the field in 2023. All three were incompletions though, including an interception on a miscommunication. Hope to see more quality on similar quantity the rest of the way.
Heyward-Behind-the-line: 3/3 (100 percent). 0-5 air yards: 13/18 (72.2 percent). 5-10 air yards: 4/7 (57.1 percent). 10-15 air yards: 2/3 (66.7 percent). 15-20 air yards: 0/0. Explosive: 0/3 (0 percent).
It’s mainly been 0-5 air yards for Heyward, and has a respectable catch rate at five air yards or less (76.2 percent). His five-ten air-yard completion rate dips significantly, and only three targets in the intermediate range is baffling, especially considering the five games Freiermuth missed. Three explosive targets, also with no completions and an interception hammers the painfully underutilization of the TE position by Pittsburgh in 2023.
Harris-Behind-the-line: 11/14 (78.6-percent). 0-5 air yards: 12/13 (92.3 percent). 5-10 air yards: 0/1 (0 percent). 10-15 air yards: 1/1 (100 percent). 15-20 air yards: 0/1 (0 percent). Explosive: 0/0.
Harris has been a very reliable safety net at five air yards or less, including a stellar catch rate at 0-5 air yards. One of three on all attempts past five yards, all coming the first four weeks of the season, and longest completion at 11 air yards.
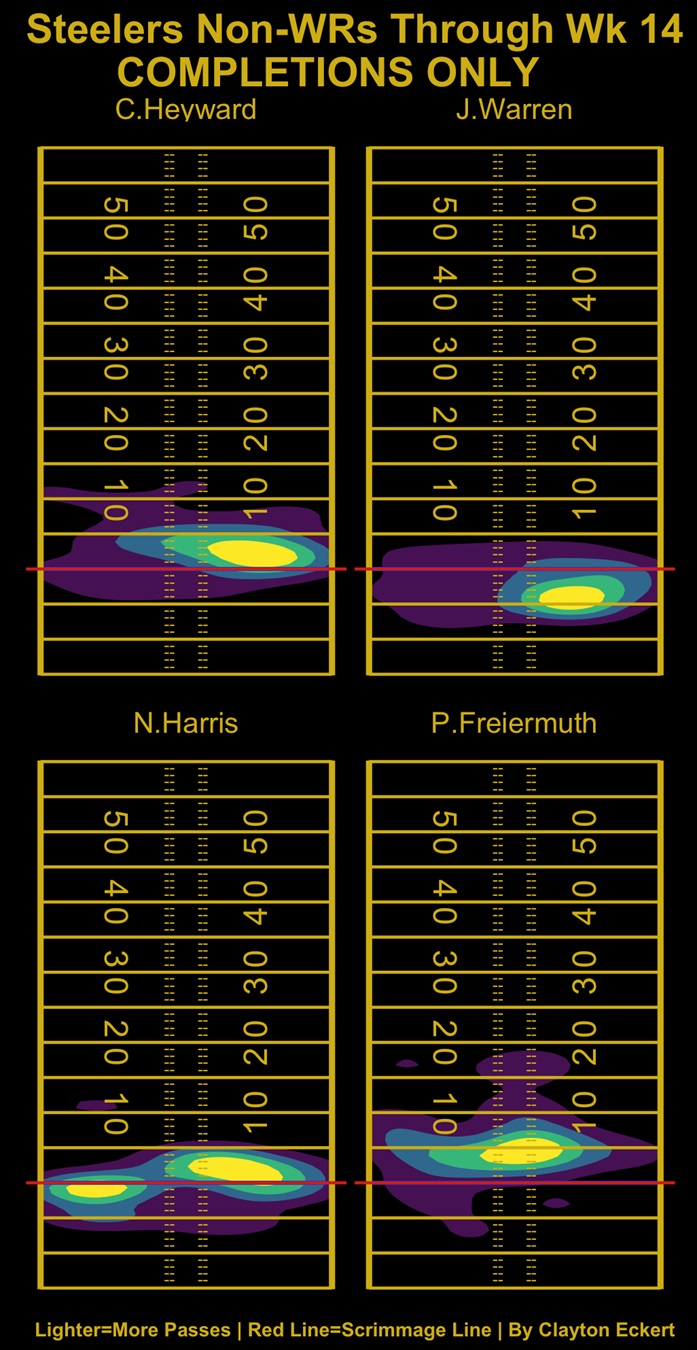
To close, here is the non-RBs completions only heat map:
Whoof. A severe lack of production from the group in terms of pass-distance, which is expected at RB. TE usage, or lack thereof, has been the confusingly frustrating part.
Freiermuth has only four catches past ten yards, while Heyward has two. Just seven targets between the numbers at that distance for Freiermuth (28.6 percent catch rate) and four for Heyward (25 percent catch rate). Too much talent there for these painful truths, and here’s to hoping for more the rest of 2023, which is reasonable to be optimistic for considering an uptick in recent weeks.
Warren most targeted area: outside right hash-outside right numbers at behind-the-line-three air-yards. Most completed area: same.
Freiermuth most targeted area: left hash-inside right numbers at 2-nine air-yards. Most completed area: between the numbers at 3-6 air yards.
Heyward most targeted area: outside right hash-outside right numbers at 0-5 air-yards. Most completed area: outside right hash-outside right numbers at 0-four air yards.
Harris most targeted area: left hash-outside right numbers behind the line to four air-yards, and near left numbers behind the line. Most completed area: same.
Thanks for reading and let me know your thoughts in the comments.

