
For a fun offseason exercise, I wanted to look at and provide data on the Pittsburgh Steelers 2022 pass defense, with the goal of seeing where they exceled from a stat perspective compared to the rest of the NFL, along with areas they struggled and will be looking to improve. I took a look at what Sports Info Solutions (SIS) has to offer in terms of team pass defense stats, and I will visualize several aspects the Steelers were in the top/bottom 10 across the league, and by the end provide a table with the Steelers ranks in all of SIS’s data points.
Let’s start with a lay of the land, with how many pass attempts NFL defenses faced, and the yardage they allowed:
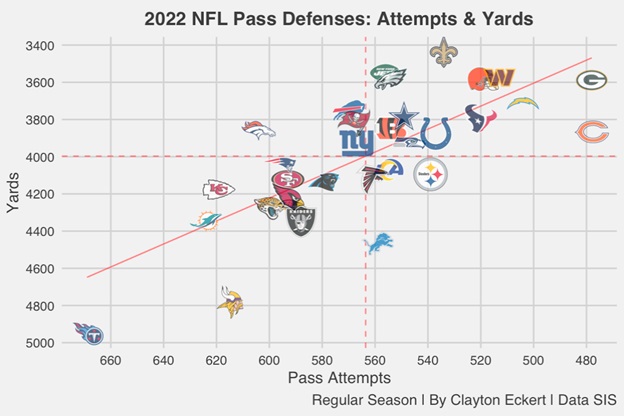
The 2022 Steelers defended a below average number of pass attempts (539) which was ninth least, which is an interesting tidbit compared to the rest of the NFL. This gives a bit of unfortunate context to their below average 4,095 yards allowed which ranked quite a bit lower at 20th. So, while Pittsburgh’s pass defense wasn’t strained in terms of quantity, an area they will surely be looking to improve this season is their yardage allowed.
Encouragingly, they improved all the way to eighth best in yardage allowed after the bye compared to 27th the first nine weeks of the season, which is one of the many great positive strides that the entire 2022 team made. It will be interesting to see how they fare this season, with hopeful health particularly from star edge rusher T.J. Watt, whose return in week 10 of 2022 correlates with much of the stronger defensive results as expected.
With several new pieces on defense, they may require a bit of patience in pass defense to start the 2023 season, but here’s to hoping they come together and play well.
Next, let’s look from a rates perspective, viewing completion rates along with catchable percentages (catchable passes/attempts):
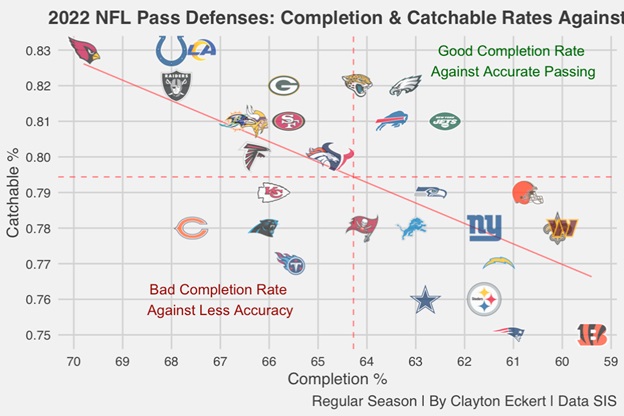
Pittsburgh lands on an interesting point on the chart, with a very respectable 61.6% completion rate allowed that tied for seventh. We get very important context with the 76% catchable rate that they faced, which tied for the third least in the NFL. So, in comparison to the rest of the NFL, the Steelers faced less accuracy from opposing quarterbacks throughout the season. Many consider the Pittsburgh Steelers 2023 schedule more favorable than others, and here’s to hoping this is the case again including low catchable percentages. Regardless, here’s to hoping for another strong season in completion rates.
Here are a couple more yardage stats, yards per attempt and coverage snap:
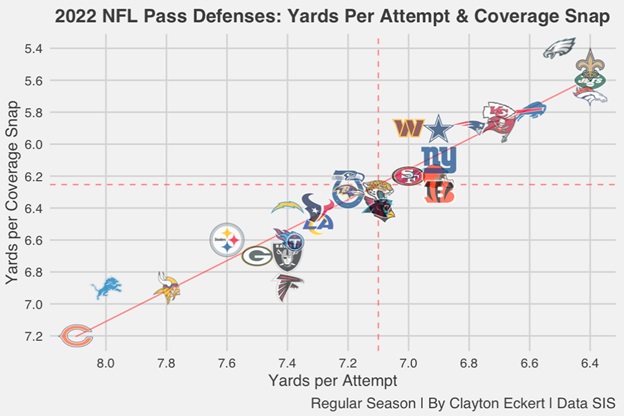
Here we see an aspect the 2022 pass defense was below average in last season, with their 7.6 yards per attempt ranking a lowly 29th and 6.6 yards per coverage snap tying for 25th. This highlights the earlier point of needing to keep a lid on opposing offenses more in 2023. They fit the common theme of improvement from week 10 on though, with a 6.1 yards per coverage snap that tied for 12th, but a more subtle bump to 7.3 in yards per attempt that tied for 21st.
One of the most impactful factors in the game is touchdowns and interceptions, so let’s look at those momentum swinging numbers:
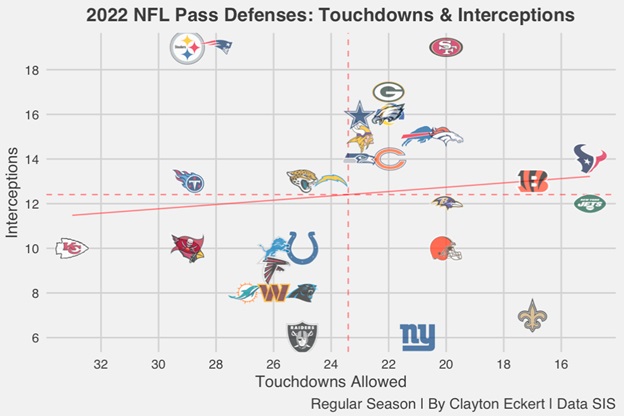
Right away we get the friendly reminder (if you followed the team in 2022) that the Pittsburgh defense tied for the most interceptions in the NFL, which was the most encouraging positive on the year, as well as a ranking perspective. The other side of the coin was 29 touchdowns allowed though, which tied for the second most in the NFL (T-28th). That is one of the biggest aspects that they will need to improve, with the scoreboard obviously the ultimate factor in deciding games.
They improved in this regard through the season as well, allowing 17 touchdowns in their first eight games which tied for the most in football, compared to 12 in the last nine games which tied with several teams in the middle of the pack. I will borrow the famous quote from offensive coordinator Matt Canada, but spin it to the defense, “They’ve gotta score less points”.
Now for a couple fun SIS metrics, boom and bust rates which measure more impactful plays:
- Boom%:The percentage of dropbacks that resulted in an EPA of 1 or more (i.e. a very successful play for the offense)
- Bust%:The percentage of dropbacks that resulted in an EPA of -1 or less (i.e. a very unsuccessful play for the offense)
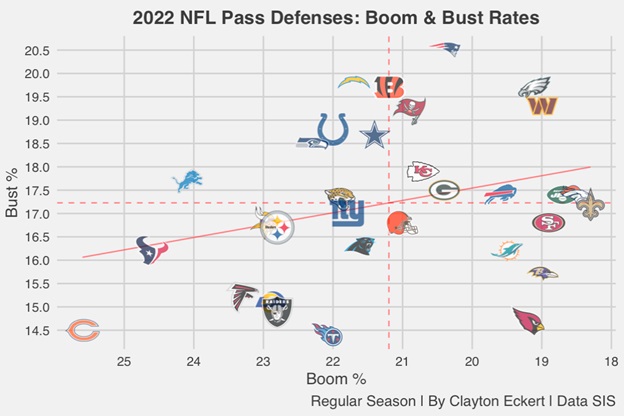
This was another element of 2022 that was less than desirable, starting with a 22.8% boom rate, tying for 25th in allowing very successful plays for opposing offenses on the season, along with a 16.7% bust rate that was expectingly better given their interception totals, but were still below average on the year (22nd).
In terms of boom percentage, the Steelers were 27th the first eight games compared to 22nd from weeks 10-18, so an improvement as well that can hopefully be even better in 2023. An incredibly notable leap came in bust rate, ranking a lowly 30th the first half of the year, compared to a substantial leap to fifth best to end the season, including 11 of their 19 interceptions.
I came across a far less talked about topic as I was scouring the SIS stats, defensive pass interference penalties, and yardage on those calls:
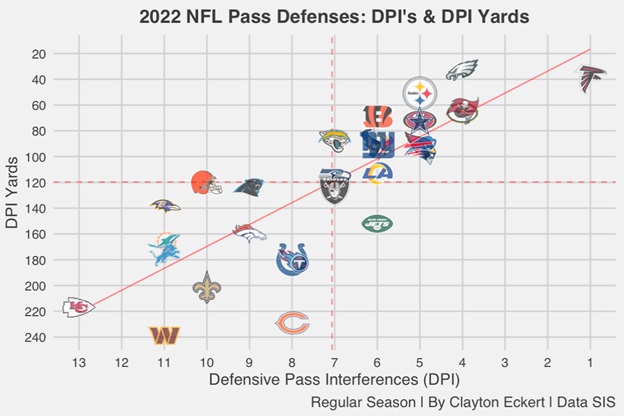
Pittsburgh was refreshingly well above average, with just five defensive pass interferences called in 2022, which tied for fifth least, along with the yardage on those plays being the third least in football. This will be interesting to monitor with a lot of turnover at the defensive back position, including two rookie cornerbacks known for physicality and aggressiveness. These “hidden yardage” plays can add up, and here’s to hoping it’s not an issue for the 2023 Steelers, providing similarly strong results to last year’s squad.
For the last visual, I wanted to provide SIS’s points saved metric. This is defined as the total EPA responsibility while in coverage using the Total Points system that distributes credit among all players on the field for a given play (with positive numbers being good). Totals are scaled up to map to the average points scored or allowed on a team level, with snaps determining how much to adjust. For pass defense, this includes accounting for pass rush, broken tackles, dropped interceptions, turnovers, and turnover returns:
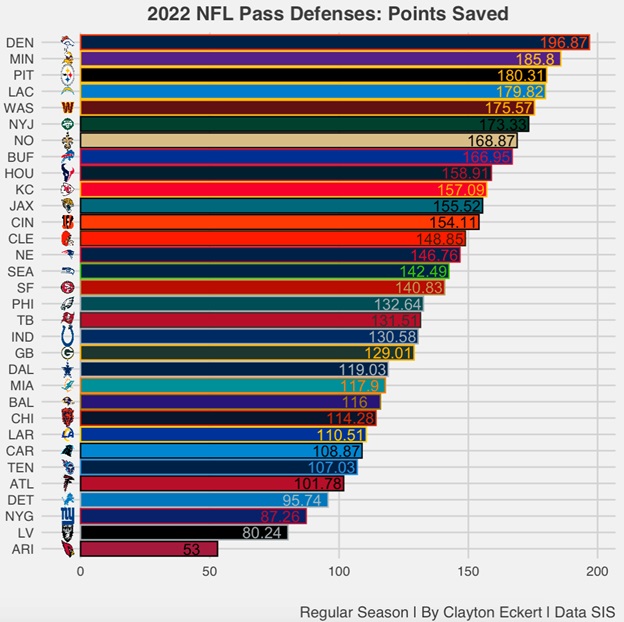
An extremely strong facet of the 2022 Pittsburgh defense came in points saved, ranking third best, which is very encouraging with such important elements factored in. While it’s obvious the roster turnover creates several unknowns that we will need to watch play out, I hope you enjoyed the deep dive of the SIS stats, and here’s to hoping for a strong 2023 from the pass defense.
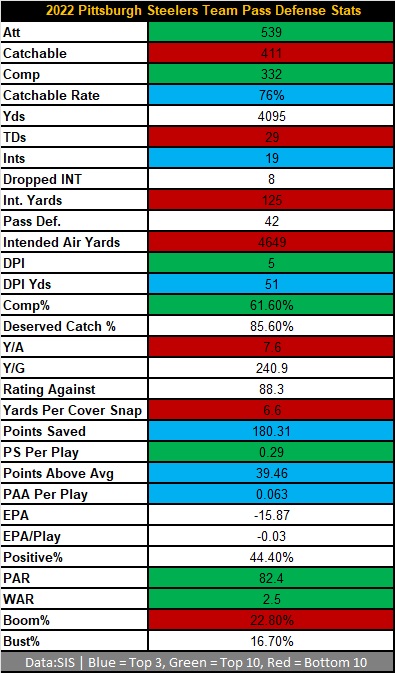
Here’s the table of all the data I came across to soak in the Steelers 2022 pass defense stats, along with SIS’s glossary of terms if you’d like/need further explanations:
What are your thoughts on the data, and outlook for the pass defense in 2023? Thanks for reading and let me know your thoughts in the comments.