A little late but I’ve hammered out my final Pittsburgh Steelers’ 2022 defensive charting. Going through our weekly data, it’s a labor of love, but provides a ton of great information to talk about this year and compare to previous seasons.
If you have any questions about the defense, individually or collectively, that you don’t see in the data below, feel free to ask and I will see if I can come up with an answer.
– Excluding no plays and kneeldowns, the Steelers’ defense was on the field for 1,012 snaps this season. An average of 59.5 per game. It’s a remarkably low number for the pace they were on throughout the year. After the first month, they averaged 74 plays per game and after the first half of the year, they still averaged 66.1.
Their 1,012 snaps were barely more than the 992 in 2020, the last 16-game NFL season. Pittsburgh’s defense didn’t see the field much in the back-half of the year thanks to their success and the offense playing solid ball-control football. Since the bye, the Steelers averaged just 53.7 snaps per game. Against Carolina, they logged just 43 snaps. Here are the year-by-year snap count numbers.
2022: 1,012 snaps (59.5 per game)
2021: 1,108 snaps (65.2 per game)
2020: 992 snaps (62 per game)
2019: 1,067 snaps (66.7 per game)
2018: 1,021 snaps (63.8 per game)
2017: 979 snaps (61.2 per game)
2016: 1,040 snaps (65.0 per game)
2015: 1,102 snaps (68.9 per game)
– In a broad view, here are the personnel groupings.
Nickel: 37.8% (383 snaps)
3-4: 24.9% (252 snaps)
Dime: 17.9% (181 snaps)
3-3-5: 11.9% (120 snaps)
4-4: 4.4% (45 snaps)
3-5: 2.3% (23 snaps)
Amoeba: 0.5% (5 snaps)
Goal Line: 0.2% (2 snaps)
4-3: 0.1% (1 snap)
Rates are down across the board with the Steelers so finely chopping up their personnel groupings, much of it done to compensate for losing T.J. Watt after Week 1 through the bye week. Nickel was over 47% last year so it dropped by nearly 10%. Base fell by about 7%, sitting at 33.8% in 2021. Dime was the same, increasing by less than a point.
The interesting thing here are all the groupings, all the variation. This year, the Steelers used a whopping 22 different groupings (excluding ones where they had too few or too many men on the field). Compare that to 2021 when they used just 11. So the number literally doubled. I’ll run through each one briefly:
1-4-6 Amobea Defense – 5 snaps
Normal 3-3-5 – 79 snaps
3-3-5 “Big” (three safeties) – 1 snap
3-3-5 Over (shifted) Front – 36 snaps
3-3-5 Over/Big – 1 snap
3-3-5 “Small (three corners) – 3 snaps
Normal 3-4 – 155 snaps
3-4 Big – 21 snaps
3-4 Nickel (three corners) – 4 snaps
3-4 Over (shifted) Front – 18 snaps
3-4 Over/Big – 6 snaps
3-4 Over Trio (3 ILBs) – 21 snaps
3-4 Trio (3 ILBs) – 26 snaps
3-5 Normal – 23 snaps
4-3 Normal – 1 snap
4-4 Normal – 45 snaps
Dime Normal – 178 snaps
Dime Big (3 DL) – 3 snaps
Goal Line – 2 snaps
Nickel Normal – 348 snaps
Nickel Big (three safeties) – 28 snaps
Nickel Trio (3 ILBs) – 6 snaps
This doesn’t include the too many/too few men snaps so these numbers don’t align perfectly to the 1,012 total if you’re wondering.
You can see how much work the coaching staff put in to making this defense work as they battled through injuries and teams with different gameplans. Pittsburgh was always trying something new. Long gone are the days of just base/nickel/dime.
Big-picture, here are the sub and base rates (this excludes goal line snaps, which don’t fall into either bucket):
Sub: 68.2% (689 snaps)
Base: 31.8% (321 snaps)
Compare that to year-by-year rates since 2015.
2021:
Sub: 64.4%
Base: 35.6%
2020:
Sub: 60.1%
Base: 39.9%
2019:
Sub: 68.5%
Base: 31.3%
2018:
Sub: 68.4%
Base: 31%
2017:
Sub: 61.1%
Base: 38.8%
2016:
Sub: 70.5%
Base: 28.7%
2015:
Sub: 71.3%
Base: 27.4%
Sub is up nearly four points compared to 2021 and on the higher-end since we’ve been tracking though it’s lower than it was in the early days of 2015 and 2016. Teams like the Ravens and Browns with their run-first styles have the Steelers play in base defense more and base is still used at least 30%+ of the time every year since 2017.
– The Steelers’ blitz rate in 2022? 27.9%. That’s up nearly two points from a year ago. Here are the season-by-season rates:
2014: 28%
2015: 33.3%
2016: 39.7%
2017: 33.2%
2018: 44.1%
2019: 33.5%
2020: 35.6%
2021: 26.1%
2022: 27.9%
It’s up from a year ago but still the second-lowest since 2014. Pittsburgh’s really relied on their four-man rush, even without T.J. Watt, in part due to a secondary that had its struggles the first half of the year.
Here’s their 5+ rush rate on the season. 28.2%. That’s up quite a bit from 2021 when it sat at 22.7%. Again, the yearly tracking:
2015: 33.6%
2016: 27.7%
2017: 19.5%
2018: 36%
2019: 34.3%
2020: 38.9%
2021: 22.7%
2022: 28.2%
Still a lower rate than several other seasons, though, down 10% from even two years ago.
– Let’s jump into the position group numbers.
Defensive Line
Pressures
Cam Heyward: 41
Larry Ogunjobi: 19
Chris Wormley: 9
Tyson Alualu: 6
Montravius Adams: 2
DeMarvin Leal: 2
Carlos Davis: 1
Isaiahh Loudermilk: 0
Snaps per pressure. Lower the number, the better.
Davis: 7.0
Heyward: 11.5
Ogunjobi: 19.0
Wormley: 21.0
Alualu: 23.8
Leal: 46.0
Adams: 65.0
Loudermilk: Infinity (49 rushes)
Heyward had 42 pressures last year, 41 this year, but his per-pressure rate was better in 2022 (11.5) than 2021 (13.0). A dude who literally is getting better with age. Alualu’s rate doubled from last year to this year. In 2021, it was 12.7. End of the line for him. Adams’ pass rush was way down too though he had fewer good opportunities, seeing fewer snaps in sub-packages.
Leal had an interesting rookie year and has talent but no pass rush plan. Two pressures all year, none solo, with an ugly 46-per. He’s got work to do. Should also note Davis had just seven pass rushes so a really small sample size here.
– Yards per carry allowed when each player is on the field. The player isn’t totally responsible for this number, of course, but it’s a stat to look at that provides a level of context.
Adams: 3.4
Heyward: 3.9
Ogunjobi: 4.1
Leal: 4.1
Loudermilk: 4.5
Alualu: 4.7
Three Steelers who played relatively significant snaps last year allowed YPC over five yards. So staying under that is refreshing.
Linebackers
Pressures
Alex Highsmith: 44
T.J. Watt: 27
Malik Reed: 8
Snaps per pressure. Again, lower the number, the better.
Watt: 10.4
Highsmith: 11.4
Reed: 26.1
Watt still leads the way with the best pressure rate, 1.0 above Highsmith, though his pressure rate is far worse than last year (6.8). Still, 10.4 is a great figure. Highsmith built on his 2021 number of 16.1. To put Reed’s number in perspective, it’s worst than Derrek Tuszka and Taco Charlton last year. Not good.
For reference. The Steelers’ pressure rate with Watt (Week 1, 10-18) compared to without him (Weeks 2-8).
With Watt: 30.9%
Without Watt: 20.5%
More than a 10% difference. That’s the value of T.J. Watt.
Coverage Rates:
Watt: 5.7%
Highsmith: 9.7%
Reed: 9.5%
DeMarvin Leal, by the way, sat at 2.1%. He dropped into coverage twice this year. Watt’s number was just over 10% last year so his number was nearly cut in half. Team probably really wants him to focus on pass rush after missing him so long. Highsmith’s number is near-identical as last year (9.4%) and is the “norm” for the position these days.
For the ILBs, Myles Jack blitzed 30 times this season. Devin Bush did 34 while Robert Spillane did 47.
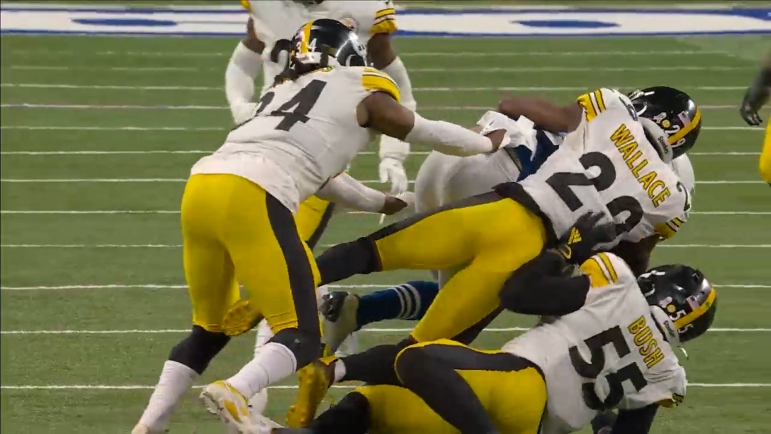
Again, numbers are broad and not 100% on the player, but YPC against when on the field.
Mark Robinson: 3.0
Devin Bush: 4.0
Robert Spillane: 4.0
Myles Jack: 4.5
Target Numbers:
Jack: 26/34 188 yards 1 TD 0 INTs
Bush: 17/26 187 yards 0 TDs 0 INTs
Spillane: 21/27 206 yards 1 TD 0 INTs
Robinson: 2/2 33 yards
QB Rating Against:
Bush: 86.5
Jack: 98.7
Spillane: 110.8
No one is very good here, though, that’s become expected for the ILB position. Rarely do you get a “good” set of numbers unless you can pick a few passes off. But Jack’s numbers are worse than I hoped they’d be, I’ll say that.
Defensive Back
Target Numbers:
Josh Jackson: 5/7 60 yards 0 TDs 0 INTs
Tre Norwood: 5/12 66 yards 0 TDs 0 INTs
James Pierre: 9/25 83 yards 0 TDs 1 INT
Ahkello Witherspoon: 19/25 238 yards 4 TDs 1 INT
Terrell Edmunds: 13/26 207 yards 3 TDs 0 INTs
Arthur Maulet: 19/28 326 yards 2 TDs 1 INT
Minkah Fitzpatrick: 14/32 251 yards 2 TDs 6 INTs
Cam Sutton: 27/60 321 yards 4 TDs 3 INTs
Levi Wallace: 34/66 546 yards 3 TDs 5 INTs
QB Rating against:
Pierre: 29.3
Fitzpatrick: 52.5
Norwood: 59.7
Wallace: 63.1
Sutton: 63.3
Edmunds: 75.8
Maulet: 116.1
Witherspoon: 128.0
Jackson: 136.9
Some great numbers at the top. Fitzpatrick has turned in great numbers year-after-year. Wallace and Sutton really did well and improved down the stretch. At the bye, Sutton’s QB against was 71.3. Wallace’s was 82.1. Edmunds’ numbers against have been solid and that’s without really ever taking the ball away. Over the last two years, he’s allowed just a 48.4% completion rate against.