Today I wanted to provide some valuable team metrics for the regular season thus far, and by the end of the article use a cumulative format I came up with this summer to summarize how teams have fared along with takeaways for the Steelers season and remaining schedule. The linked article dives thoroughly into the value of the data and their predictive measures to winning, which we know has not been up to Pittsburgh standard, but was curious and wanted to provide data on how they have stacked up compared to the league. The three main stats used are Adjusted Net Yards per Pass Attempt (ANY/A), Turnovers and Explosive Plays (TOX), Adjusted Early Down (AED) Success Rates, and the total calculations called CATS for short.
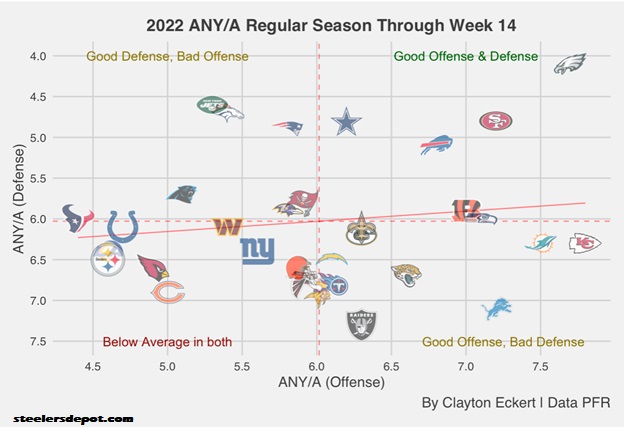
First, let’s look at ANY/A which is defined as (Passing Yards – Sack Yards + (20* Passing TD) – 45 * Interceptions)) / (Passes Attempted + Times Sacked). Using the differential for offenses and defenses, this is the most predictive individual stat in predicting Super Bowl Winners that I have found in my studies:
Right away we get very telling results and answers in terms of the Pittsburgh Steelers’ struggles this season, and important context to how it compares league-wide. On offense, their very low 4.6 ANY/A number is tied for 30th with the Los Angeles Rams and bests only the Houston Texans (4.4), which they tied for dead last with at the same number through week 12 for a bit of optimism. The Steelers’ defensive ANY/A of 6.5 ties with another Los Angles team in the Chargers, which has also improved the last two weeks, but only by a decimal point. This leads to a differential of -1.9, which ties for dead last in the NFL with the Chicago Bears, emphasizing the tough season we’ve endured as Steelers fans though there have been small improvements in the passing game as of late.
Looking at the teams above the mean on both offense and defense, we see six teams. The Philadelphia Eagles are far and away the best team on both sides of the ball, comfortably with the top rank on defense along with their second rank on offense behind Kansas City and a strong differential of 3.6, which is a full point above any other team. The 49ers come in second in differential, with a 2.4 and are tied for fourth on both sides of the ball. Next up are the Bills, who have the third-ranked differential of 1.7, ranking seventh on defense and eighth on offense, below expectations recently after a hot start to the season. Dallas, Seattle, and Cincinnati are the other teams above the mean in both, the former thanks to a strong defense that ties for fourth with the 49ers, and the Seahawks and Bengals landing close to each other on the chart with the sixth and seventh-ranked offenses, along with defenses toting the line of the Super Bowl predictive winning criteria.
Teams that land in the top five on offense with lower results on defense are highlighted by the Chiefs and Dolphins, ranking first and third in the pass game respectively. If the historical playoff criteria holds true for this year’s playoffs (defensive ANY/A below six), they would both need to come on strong defensively to end the regular season, tying for 18th currently at 6.3. Detroit has really improved on offense this season, with an impressive fifth rank to date. Strong defenses with lower offensive numbers include the Jets, Broncos, and Patriots, whose defensive ANY/A’s rank second, third, and sixth respectively. In the division, the Ravens land toward the middle of the chart and have a 5.8 number on offense (third in the division and 1.2 above Pittsburgh!) along with their defensive number at 5.9 for a -0.1 differential, teetering the line of the predictive measures, and will be interesting to see how they fare on both sides of the ball to close the season. The Browns have the worst defensive number in the AFC North (6.6), a tick below Pittsburgh but rank second on offense.
Next, let’s see how teams have fared in the turnover and takeaway departments:
Eight teams clearly land above the mean on both sides of the ball, starting once again with Philadelphia. They impressively have only turned the ball over 10 times on offense, and have turned their opposition over 24 times for a stellar +14 differential, which each rank first in the NFL. The divisional opponent Ravens tie for second in takeaways with the Cowboys with 23, with the former having the better mark on offense with 14 turnovers for a second-ranked +9 differential, and Dallas just behind with 15 turnovers and a third-ranked differential (+8). The 49ers and Minnesota tie for the fourth-ranked differential (+6), with the former having one more takeaway than the latter’s additional turnover. The remaining teams above the mean in both are the Jaguars, Chargers, and Lions. Cincinnati’s offensive result is notable, tied for the second lowest turnovers (13) and near the mean in takeaways (15).
Pittsburgh lands toward the middle of the chart, just above the mean with 17 takeaways on defense that ties for tenth in the league (none last game though), along with historical improvements on offense that were squandered in last week’s three-interception outing from quarterback Mitch Trubisky. This facet of the game is something I am eager to monitor, seeing if the Steelers can get back to their blueprint of success in the final stretch of the season.
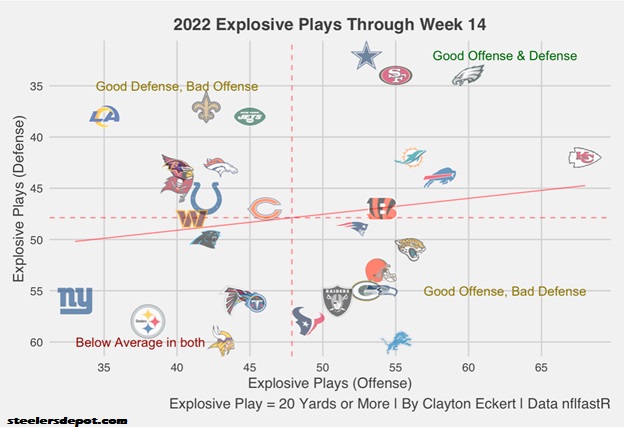
Now, here are the explosive play results (passing and rushing plays of 20+ yards) for NFL offenses and defenses:
The Eagles yet again have a top rank in the important metrics, with their +26 differential tying with the Chiefs. Kansas City has far and away the most explosive plays on offense, a whopping 68 compared to Philadelphia’s 60 which ranks second. The former has allowed explosive plays as well though (42, T-seventh) while the latter ties for second on defense with the 49ers, allowing 34 explosive plays. San Francisco pairs this result with 55 explosive plays on offense, which ties for sixth in the NFL. The Cowboys’ great defense has the fewest explosive plays allowed (32), and tie for 11th on offense, tying for the third-best differential. After a drop off, the Bills and Dolphins come in with +14 differentials, with the former having one more on offense.
The Bengals are notable once again, just above the league mean on defense along with 54 on offense which ties for eighth league-wide. Cleveland has matched them on offense, but have been worse on defense, allowing 53 which ties for 21st through 2022. Baltimore lands in a cluster on the top right, tying for ninth on defense with 43 allowed but a much lower rate on offense with 40, which is third in the division. Finally at the bottom left we see Pittsburgh, who have 38 explosive plays and rank 30th on offense (only above the Rams and Giants), poor on defense, and well allowing 58 which ties for 29th. This gives them the 31st-ranked differential in the NFL at -20, and adds context to just how much this facet of the game has hurt the team this season.
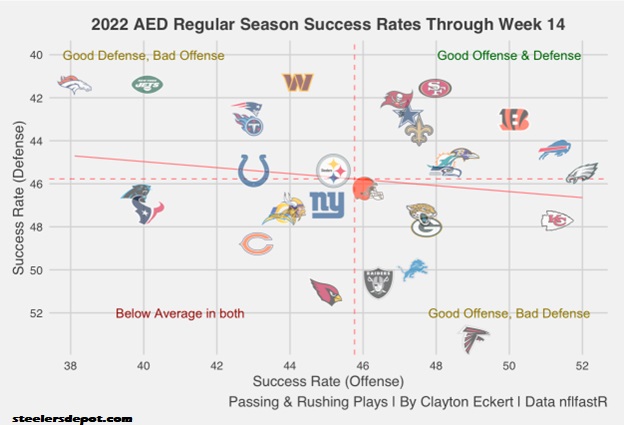
Here are the successful play results, using AED that measured the strongest in my research and adjustments of success rates, and is defined as six yards or 50% of the needed yardage on first down, six yards or 60% of the needed yardage on second down, and third or fourth downs gaining the needed yardage for a first down or a touchdown:
Here we have 10 teams above the mean in success rates, and ordering them by offense include the Eagles, Bills, Bengals, Ravens, Dolphins, Seahawks, 49ers, Saints, Cowboys, and Buccaneers. The Browns and Steelers land near NFL average, with the former just above the mean on offense and Pittsburgh landing just above it with a 45.4 with ties for 14th in the league. Their offensive number is just below average at 45.19 which ranks 18th. So, their explosive play and ANY/A results have been the worst and crucial elements of Pittsburgh’s 2022 season, while their turnovers and success rates have been closer to league average as we search for optimism. Across the league, the teams that are above average in all the data include the Eagles, 49ers, and Cowboys, while the Chiefs, Bills, Bengals, and Dolphins round out the top eight teams collectively.
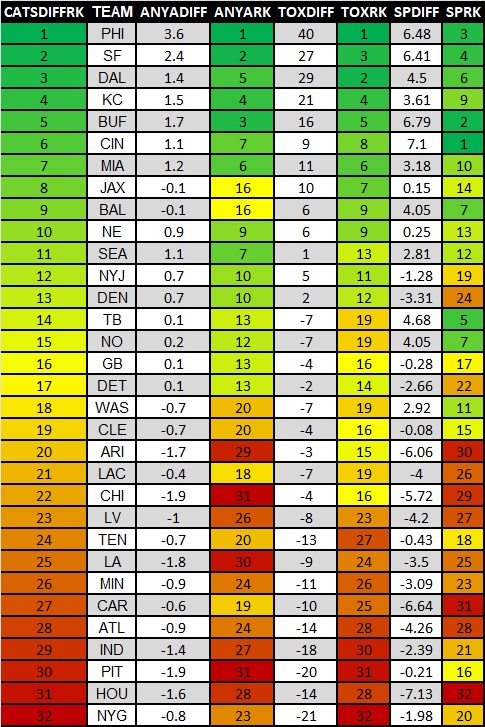
Speaking of which, here’s a table of the stats used today showing the differential numbers of teams offenses and defenses along with their ranks, and sorted by CATS differential to close:
What are your thoughts on the results of the 2022 season? How do you think Pittsburgh will fare in the final four games? Thanks for reading and let me know your thoughts in the comments!

