Continuing with the series, I wanted to look at and provide more context with situational football for the position in their final season using Sports Info Solutions (SIS). Similar to the red zone study I’m focusing on players selected in the 2022 NFL draft on third down, and a few players were excluded due to SIS not tracking smaller school players. This time around I’ll key in on players with larger sample sizes as well. The goal for today is to see how Calvin Austin III stacked up to his peers last season, while continuing that focus for the next article with George Pickens included when he saw more action in the 2020 season.
First, let’s look at opportunity with the number of routes run and targets on third down:
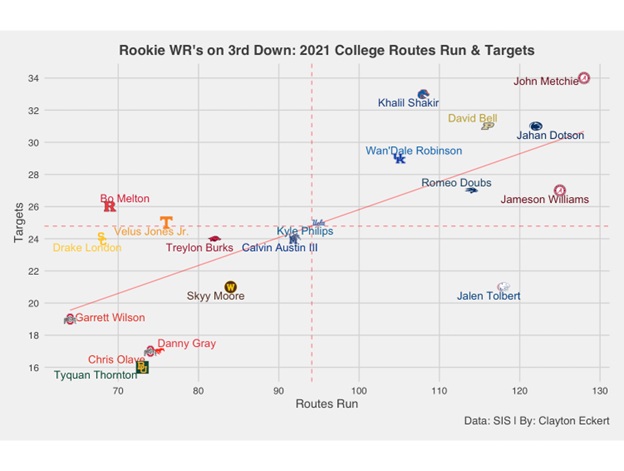
Interesting results overall, especially seeing the number of third down plays for certain teams such as Alabama, and similar to the red zone study John Metchie (Texans) getting more targets than Jameson Williams (Lions) again in situational football considering their more comparable total targets.
Austin III ran 92 routes and was targeted 24 times, which was near the mean in both stats out of the 19 players on the graph. This initial view shows slightly below average number of opportunities compared to his peers, important context as we continue with the data.
Let’s dive deeper with completion percentage and on target catch percentage (total receptions/number of catchable targets) which highlights totality and performance on quality targets:

The players on the far right made the most of their situations on the money down, and interestingly all but two players have overall completion percentages above 60 percent.
One of these players is Austin III, who had substantially the worst results in both data points. The particularly discouraging number is on target catch percentage, but interestingly SIS does not have him listed for any drops. An example of such a play for context was against Houston when he was targeted in the end zone but was tripped up, so while the pass was on target he was unable to make a play on the ball.
The low on target catch percentage is a reoccurring theme in each article I’ve done in the series with the only exception being 2020 in the red zone. It will be interesting to what Austin III’s 2020 third down production looks like in the next article, considering the vast difference the red zone data showed with different quarterbacks at the helm each season.
Here is a similar view to the first study, viewing the wide receivers completed air yard percentage (CAY% = completed air yards/intended air yards) to gain context of opportunity and connectivity along with a and yards after catch percentage (YAC% = yards after catch/total yards) to see what wide receivers created once the ball was in their hands. This gives us great context of what the players provided for their team and how they were used, along with seeing who fared best on drive extending situations in their final season:
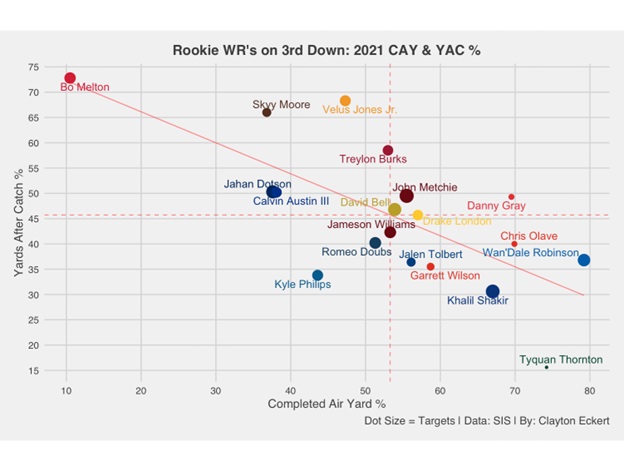
Austin III was well below the mean with the fourth lowest result in CAY%, and only 40% of the intended air yards thrown his way being completed. He did have an above the mean and 6th rank in YAC%, providing just over 50% of his third down yardage in this regard. A particularly great example of this YAC value came early in the game against Arkansas State on third and five, running a short drag route on a shallow cross concept and making a guy miss at the catch point on the 55-yard touchdown.
Continuing with more important factors mentioned on this play, here are the wide receivers first down percentages (percentage of receptions where the receiver achieved a first down) along with broken + missed tackles per reception, a fun and telling data point. The goal here is to see who provided moving the chains plays and which players showed the ability to make guys miss:

On Austin III’s third down receptions, he provided first downs on over 90% of them, which ranked second to only Williams who had a perfect percentage. This is encouraging context, and if given the opportunity with the Steelers in his rookie season, here’s to hoping we can see some of this value with an improved completion rate considering he only caught 11 of his 24 targets. He also lands in the middle tier of broken tackles + missed tackles percentage, with the previously mentioned play a prime example.
Let’s further examine wide receiver usage with average depth of target (average distance downfield that the targeted throws traveled, excluding spikes and throwaways) and average depth of completion:
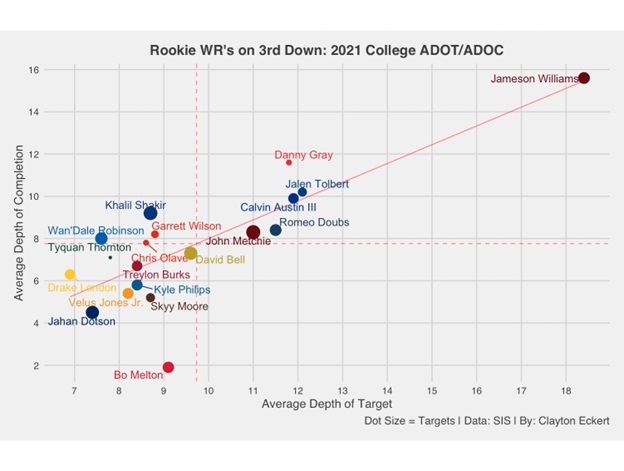
Williams ‘breaks’ this graph with extremely high numbers in both data points, which are staggering compared to his peers and highlights quality over quantity in comparison to Metchie.
Austin III lands above the mean in both data points, with a particularly healthy ADOT number of 11.9 that ranks third along with his fourth ranked ADOC landing at 9.9. These numbers provide more context to his first down percentage, considering his ADOC being ideal for the majority of down and distance situations, and his YAC% on top of that providing a high rate of conversions on his receptions for Memphis last season. Two film examples came in the Arkansas State game, one running past and stacking the defensive back on third and 15 showcasing his speed for the downfield catch on a 37-yard gain, and another where he made the catch on a post route on third and nine against tight trail coverage past the sticks and tackled at the catch point on the first down.
To close I wanted to provide a total value view using points earned per route (The total of a player’s EPA responsibility on routes run using the total points system that distributes credit among all players on the field for a given play. Totals are scaled up to map to the average points scored or allowed on a team level, with the player’s snap count determining how much to adjust. For receivers, this includes accounting for offensive line play, off-target passes, dropped passes, and broken tackles. Values are modulated using a quality-of-competition multiplier based on each opponent’s previous year of performance) and EPA per target (the total change in the offense’s expected points that came on passes thrown to the player):
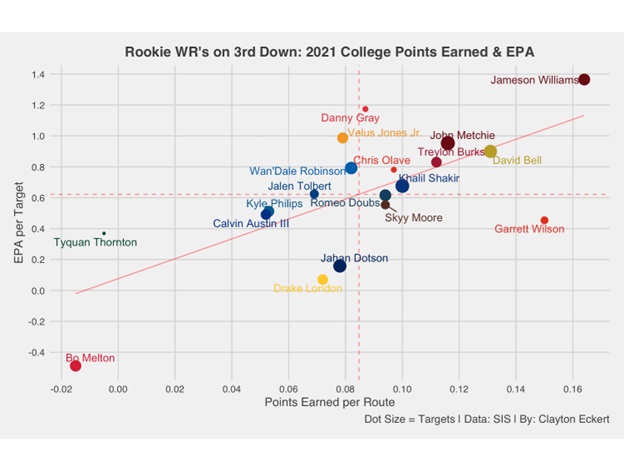
Williams tops the graph comfortably, followed by above the mean results in both data points from Metchie, Purdue’s David Bell (Browns), Arkansas’ Treylon Burks (Titans), SMU’s Danny Gray (49ers), Ohio State’s Chris Olave (Saints), and Boise State’s Khalil Shakir (Bills) with quality third down production and the dot sizes highlighting the quantity.
Austin III landed below the mean in both data points with the third lowest result in points earned per route (though closer to his peers than the bottom two) along with a better result in EPA per target near the mean. His lowest marks were completion and on target catch percentage, CAY%, and points earned per route. He was near the mean in routes run, targets, broken and missed tackles, and EPA per target, and fared the best in first down percentage, YAC%, ADOT, and ADOC. The film and stats highlight his encouraging abilities, with the main concern being the catch rates. It will be interesting to see what the 2020 stats looks like for Pickens and Austin III, and what the latter’s results look like in comparison to last season.
Throughout the rest of the offseason, I will dive deeper into the data as we continue to learn about the newest Pittsburgh Steelers. How do you think Calvin Austin III will fare in his rookie year? Do you think he could be a factor on third down? What are some of your takeaways across the league? Thanks for reading and let me know your thoughts in the comments!