Continuing with the series, I wanted to look at and provide more context with situational football for the position in their final season using Sports Info Solutions (SIS). Similar to the first study I’m focusing on players selected in the 2022 NFL draft, and a few players were excluded due to SIS not tracking smaller school players. The goal for today is to see how Calvin Austin III stacked up to his peers last season, while continuing that focus for the next article with George Pickens included when he saw more action in the 2020 season.
First, let’s look at opportunity with the number of routes run and targets in the red zone:
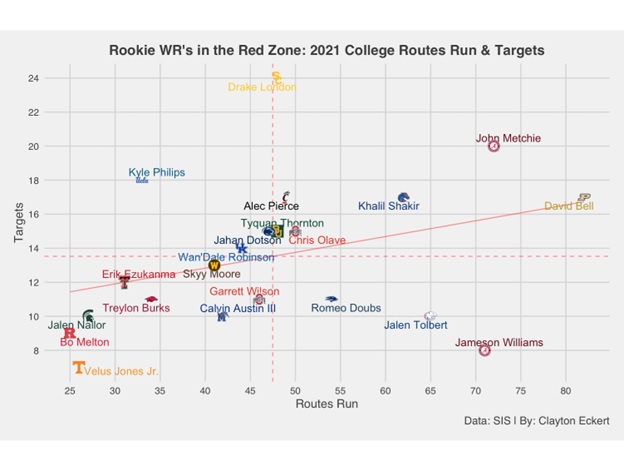
Interesting results on the whole, with some expected wide receivers near the top of both stats. It’s also fun to see the see comparisons multiple players on a team, with a clear view of Alabama’s John Metchie being the go-to target on virtually the same number of routes run as Jameson Williams, and the Ohio State receivers with closer results and less opportunity.
Austin III ran 42 routes which ranked 14th out of the 21 players and was targeted ten times, which was tied for the fourth lowest number. So, this initial view highlights his below average opportunities and usage in these situations, which is important context as we continue with the data.
Let’s dive deeper with completion percentage and on target catch percentage (total receptions/number of catchable targets) which highlights the quality of targets and connectivity:

The players on the far right made the most of their situations, and the wide receivers on the bottom right gain positive context of their low overall completion percentages with their 100% on target catch results.
Five players land on the lower left of the graph, including Austin III who was discouragingly tied for the lowest completion percentage and the second lowest on target catch percentage. While it wasn’t expected for him to top the charts, the data really provides context compared to his peers in the red zone, especially unable to capitalize in on target situations which has been a weakness throughout my studies thus far. There’s also a concern as this projects to the NFL, considering that red zone situations are times when defenses have less ground to cover, which is comparative to tighter/better coverage at the next level overall.
Next, I wanted to gain context on targets short of the goal line, and who created yards after catch along with yards after contact with their percentages charted below:
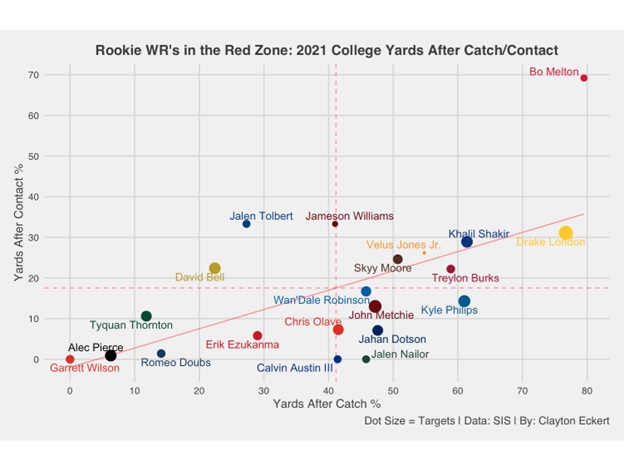
Rutgers wide receiver Bo Melton (Seahawks) was a standout player in this regard, while it didn’t equate to plays ending in the end zone. The players on the bottom left were targeted more often in the end zone largely speaking, contributing to their YAC results.
Austin III landed at the mean in yards after catch percentage, with one touchdown, but only one of three players with zero yards after contact. On the flip side, he was targeted six times in the end zone, three of which SIS deemed catchable, and none of which were caught. Let’s continue to gain context on this data with the most important factors, the players touchdown percentages in these money situations along with crucial mistakes with drop percentages:
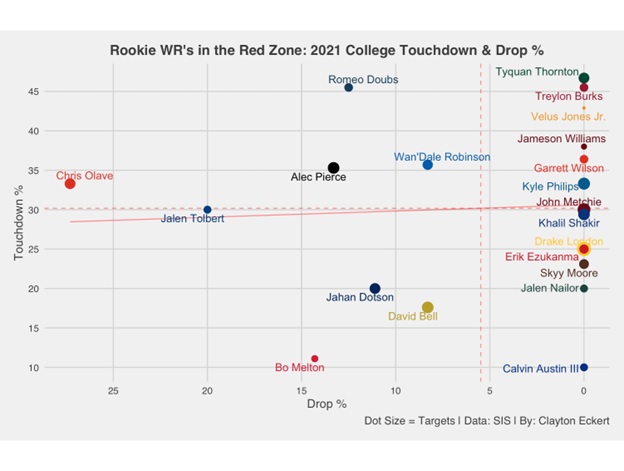
Many players land on the far right with no drops including Austin III, which is interesting considering the end zone target stats I just mentioned. I located two of the catchable targets on tape, situations where defensive backs were able to cover him well and swallow up his lack of size, particularly along the boundary. While he was charted for no drops, his red zone touchdown percentage was the lowest of any player on the graph.
To close I wanted to provide a total value view using points earned per route (The total of a player’s EPA responsibility on routes run using the total points system that distributes credit among all players on the field for a given play. Totals are scaled up to map to the average points scored or allowed on a team level, with the player’s snap count determining how much to adjust. For receivers, this includes accounting for offensive line play, off-target passes, dropped passes, and broken tackles. Values are modulated using a quality-of-competition multiplier based on each opponent’s previous year of performance) and EPA per target (the total change in the offense’s expected points that came on passes thrown to the player):
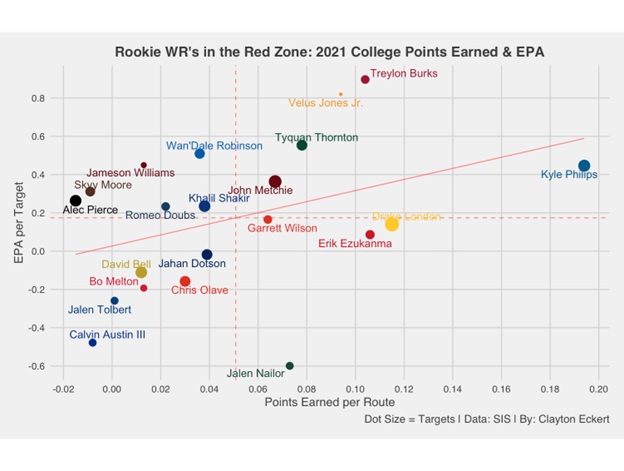
The players that landed above the mean in both data points with quality red zone play were Arkansas’ Treylon Burks (Titans), Tennessee’s Velus Jones Jr. (Bears), Baylor’s Tyquan Thornton (Patriots), UCLA’s Kyle Philips (Titans), and Alabama’s John Metchie (Texans) with the dot sizes highlighting the quantity.
Austin III landed very low as expected in both stats, with the third lowest points earned per route and next to last in EPA per target. There were many below average/poor results in this study: routes run, targets, completion and on target catch percentage, yards after contact, touchdown percentage, points earned per route, and EPA per target. The two positives he did have were a zero percent drop rate along with being at the mean in yards after catch. It will be interesting to see what the 2020 stats looks like for Pickens and Austin III, and what the latter’s results look like in comparison to last season.
Throughout the rest of the offseason, I will dive deeper into the data as we continue to learn about the newest Pittsburgh Steelers. How do you think Calvin Austin III will fare in his rookie year? Are you concerned with his red zone numbers, or will he even be used in those situations right away? What are some of your takeaways across the league? Thanks for reading and let me know your thoughts in the comments!