Today I wanted to continue to look at some 2021 quarterback numbers for the upcoming draft. So far the articles have been on mobility and a total yards view, and now I’d like to dive deeper. Let’s start with a data point those that have been following the site know that I and many on the Steelers Depot team value, Adjusted Net Yards Per Attempt (ANY/A) which is (Passing yards – Sack Yards + (20 * Passing TD) – (45 * Interceptions)) / (Passes Attempted + Times Sacked) from Sports Info Solutions:

Without negating the total yards the 12 quarterbacks threw for, this data integrates the value of touchdowns, sacks, and turnovers into a yards per attempt format. Western Kentucky quarterback Bailey Zappe tops the ANY/A list as he did in total yards and air yards, with 62 touchdowns (1st), 11 interceptions (second most), and only 16 sacks (1st!). Pitt quarterback Kenny Pickett ranks second as he did in the total yards view, with 42 touchdowns (2nd), seven interceptions (T-5th), and taking more sacks with 29 (7th).
Western Michigan quarterback Kaleb Eleby ranks third in ANY/A, compared to his fourth rank in total air yards and sixth rank in total yards along with his 23 touchdowns (8th), six interceptions (T-3rd), and 28 sacks (6th). Ole Miss quarterback Matt Coral fares much better in the ANY/A stat with more context layered than the total yards view, with 20 touchdowns (T-9th), only five interceptions (2nd), and 24 sacks (4th)! Cincinnati quarterback Desmond Ridder tied Corral’s ANY/A number for a fourth rank, with 30 touchdowns (4th), eight interceptions (T-7th), and 26 sacks (5th) to go with his fifth ranks across the board in the last article.
Kansas State quarterback Skylar Thompson fares better in a per attempt view since he missed time with an injury, ranking sixth in ANY/A with 12 touchdowns (12th), four interceptions (1st), and 20 sacks (2nd). Nevada quarterback Carson Strong ranks seventh compared to his third rank in total yards, with 36 touchdowns (3rd), eight interceptions (T-7th), and a higher 39 sacks T-9th)!
Notre Dame’s Jack Coan and Kent State’s Dustin Crum tied for the eighth rank, the former climbing a bit in the ranks compared to total yardage with 25 touchdowns (6th), seven interceptions (T-5th), but 33 sacks (8th) while the latter had 20 touchdowns (T-9th), six interceptions (T-3rd), and matched Strong’s number of 39 sacks (T-9th)!
The tenth rank in ANY/A is North Carolina quarterback Sam Howell, who had 24 touchdowns (7th), but a higher nine interceptions (10th) and second most sacks with 48! Iowa State quarterback Brock Purdy tied Howell’s tenth ranked ANY/A number, with only 19 touchdowns (11th), eight interceptions (T-7th), and 21 sacks (3rd). The bottom ranked quarterback in ANY/A is Liberty’s Malik Willis. He had 27 touchdowns (5th), but the most interceptions with 12 and sacks of any quarterback with a whopping 51!
Next, let’s look at some accuracy data:
- On Target % = The number of on-target/catchable throws a quarterback makes divided by the total number of pass attempts. Does not include plays with no reasonable accuracy expectation such as: spikes, throwaways, QB/WR miscommunications, receiver slips, and passes batted at the line of scrimmage.
- Catchable % = The percentage of pass attempts that were deemed catchable, excluding spikes, throwaways, and miscommunications and including defensed accurate passes.
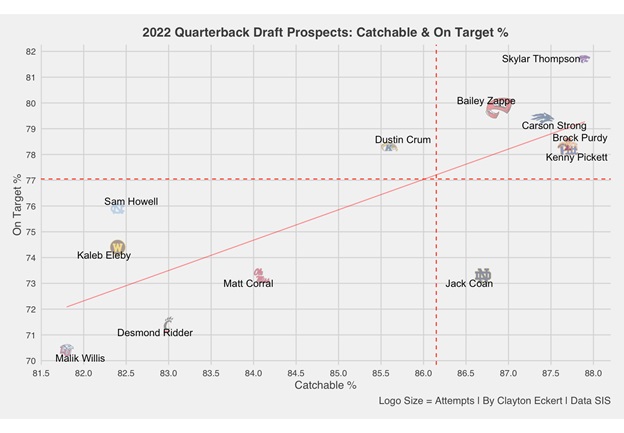
Definitely some interesting results to learn from here, with this paragraph including the quarterbacks above the mean in both data points. Thompson tops both data points with a stronger result in on target % comparatively on the fewest attempts. Zappe comes in second in on target % along with his lower fifth ranked catchable %. Strong had the third best on target % along with his fourth ranked catchable %. Purdy and Pickett tied for the second best catchable % with the former having the fourth ranked on target % compared to Pickett’s sixth rank with nearly overlapping points on the graph.
The middle tier includes players above the mean of one of the two data points. Crum had the fifth ranked on target %, very close to Purdy and Pickett along with a below the mean and seventh ranked catchable %. Coan’s sixth ranked catchable % is the final number above the mean, but much lower in on target % which ranks ninth!
Now for the quarterbacks that were below the mean in both data points. After a dropoff, Howell leads this group with the seventh ranked on target %, but a lower catchable % rank of 10th. Eleby ranks eighth in on target % (but below 75%) and the second worst mark in catchable %. Corral is the ninth ranked on target % quarterback with the eighth ranked catchable % (a noticeable drop off from Crum), but the best mark from this lower tier of the data. Ridder has the second worst on target % and a slightly better catchable percentage rank at ninth. Like the ANY/A stat, Willis is soundly the bottom ranked quarterback in both data points.
While we’re looking at percentages, I wanted to provide completed air yards % to give a different perspective than the total yards article, especially considering the readers responses and interest:
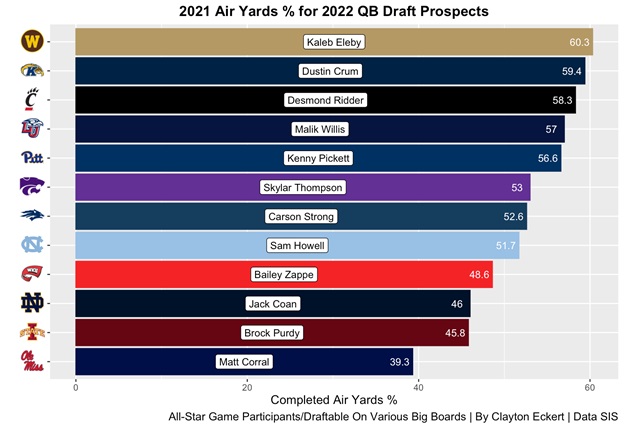
Using the percentages for different context we get some valuable information to learn from. Eleby tops the chart in this regard, and while he ranks lower in the total accuracy data, this result along with his 3rd ranked ANY/A really jumps out and intrigues me as I learn more. Crum is the second ranked quarterback, with a more middling accuracy and totality result along with a lower ranked ANY/A. Ridder lands third and fared well overall in these articles, with the exception being the accuracy graph above. Willis had the fourth rank in air yard %, and the data confirmed what many already thought, he provides great value as a runner with a big arm but a project as a passer with the lowest accuracy and ANY/A results. Pickett has the fifth rank and fared well across the board with top three ranks as a passer in total yards, total air yards, air yards %, and ANY/A along with a strong and above the mean result in accuracy!
After a slight drop off, Thompson lands sixth and while he had less snaps, fared best in the accuracy data along with a respectable ANY/A result. Strong landed lower than I expected with seventh rank in air yard % and ANY/A data but fared well in the total yards and accuracy results. Howell rounds out this tier of players with the eighth rank in air yards %, matching his total yards rank, and fared lower in ANY/A and accuracy with his best value coming as a runner in 2021.
The bottom tier of the data are passers with below 50% air yards. This gives clearer context to Zappe’s throws on his lower ninth ranked air yards % with a ton of yardage, with his top ANY/A rank benefiting along with him taking the fewest sacks, and also faring well in the accuracy data. Coan holds the 10th rank in air yard %, and his only ranks above ten were in ANY/A and catchable %. Purdy was next to last in air yards % as well as ANY/A, with his best results coming in the accuracy data. After a substantial drop off, Corral had the worst result in air yard % on his higher total yards, along with a lower accuracy result, while his best result came in the ANY/A data with a low number of interceptions and sacks.
What are some of your takeaways on the quarterbacks? Thanks for reading and let me know your thoughts in the comments!


