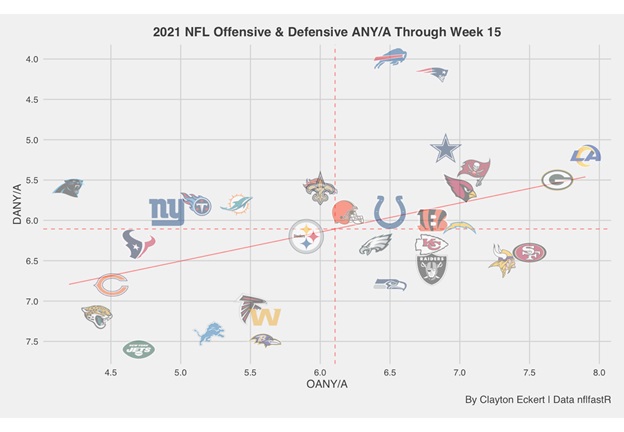
Now that each team has played 14 games, I wanted to check back in on the Adjusted Net Yards Per Pass Attempt (ANY/A) data from Pro Football Reference to see where teams sit with three games left in the season. For those of you just tuning in, ANY/A is Passing Yards – Sack Yards + (20 * Passing TD) – (45 * Interceptions)) / (Passes Attempted + Times Sacked), which is important data considering that no team has won the Super Bowl in the 2000’s with a negative ANY/A differential and a Defensive ANY/A number above 6.1. Here’s a visual for offenses (OANY/A) and defenses (DANY/A):
The teams on the top right are the frontrunners for the Playoffs and Super Bowl, and the top 6-7 teams should not shock anyone. I also enjoyed taking a look back at my previous articles on the data through Week 8 and Week 10 to see how trends are moving for the teams, monitoring consistency or if a squad has only made certain lists or dropped off as of late.
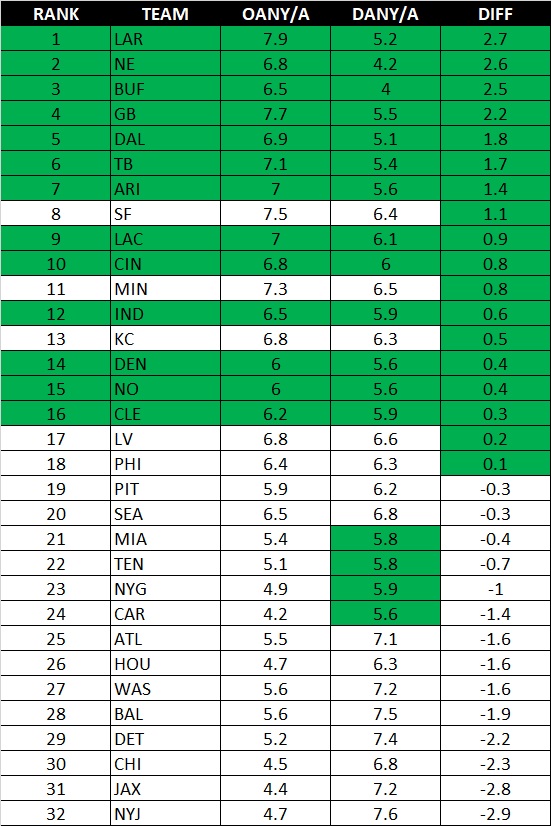
Let’s look at a table view, with teams who meet the predictive Super Bowl criteria in green:
The Rams have moved up to the top spot in differential that was previously held by the Bills since my last article. New England has shot up from the seventh best differential to second, and the Packers have also trended upward from sixth up to fourth. Out of the top seven teams, the Bucs have trended down a spot with Dallas edging them by 0.1 while trending down two spots, and the Cardinals down three. Cincinnati and Denver also made the previous list, with the former’s OANY/A dropping for a lower differential trend. Minnesota fell off the list after meeting the criteria last article, and wanted to note San Francisco and the Chiefs being a threat to make the final list with a close DANY/A with the latter surging up from a terrible 7.4 number to 6.3 since Week 10! Also found it interesting that 17 teams meet the DANY/A criteria as opposed to 12 last time. The Chargers, Colts, Saints, and Browns are the new teams to meet the criteria with the former barley sneaking onto the list in DANY/A.
Pittsburgh has moved up in this list compared to last time, only improving 0.1 in OANY/A, but only missing the DANY/A by 0.1! These results lead to an improvement from a differential of -0.8 in Week 10 to -0.3 this time around. It is an encouraging improvement, especially on defense, and while there is a chance to meet the criteria by seasons end, so can many other teams above them in the ranks and for playoff positioning. It will be very interesting to see how it all unfolds at the close of the regular season.
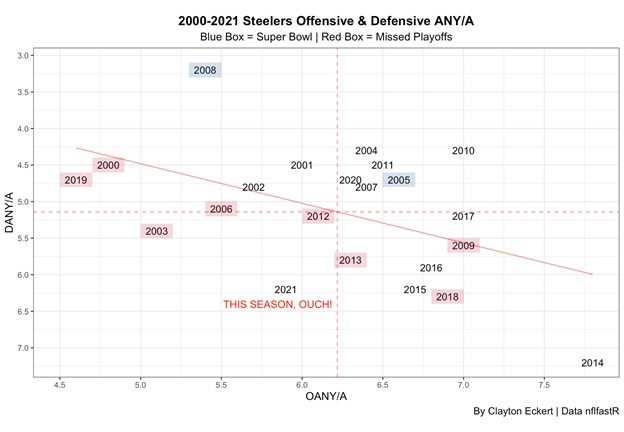
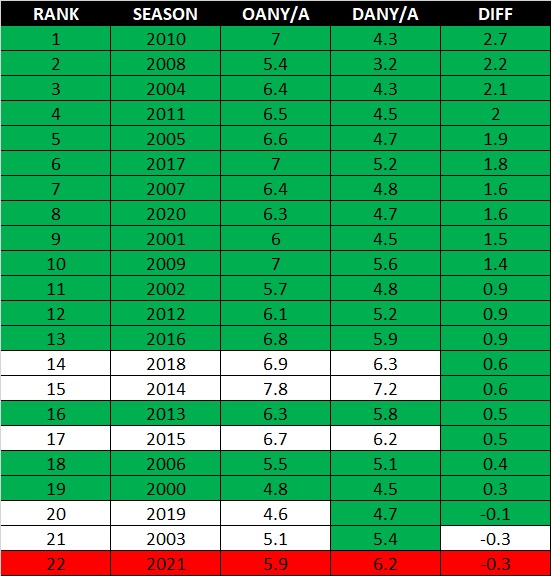
Prompted by a good question last time from Steve, and finally getting a little time to do so, I wanted to look at the Steelers history in the stat since 2000 for comparisons to this year and especially see what the numbers looked like when Pittsburgh won their two Super Bowls in the time period:
Definitely not my prettiest graph, but very telling information paired with the predictive success of the stat. Fun to see the 2008 defense up so high along with seeing where the 2005 team stacked up. The only playoff season with a lower OANY/A than this season was 2002, but with a much better DANY/A. Also, the only playoff seasons with below the mean DANY/A results had offenses to pick up the slack with above the mean OANY/A. Long story short, unsurprisingly, and historically looking bad for this year:
Out of 22 Steelers seasons, 2021 is tied for the lowest differential in the time period, and only the third time with a negative differential! The other season with the lowest differential was 2003, but they at least had a respectable DANY/A number. Speaking of which, Pittsburgh has only missed the DANY/A number in four seasons, with none of them coming before 2014! This season marks only the sixth time the Steelers have not met the Super Bowl criteria, and with three games left it will be interesting to see what their numbers look like at the end. Quoting the famous interview from former Colts coach Jim Mora with my own twist, ”Playoffs? SUPER BOWL???”
Thanks for reading and let me know your thoughts in the comments!

