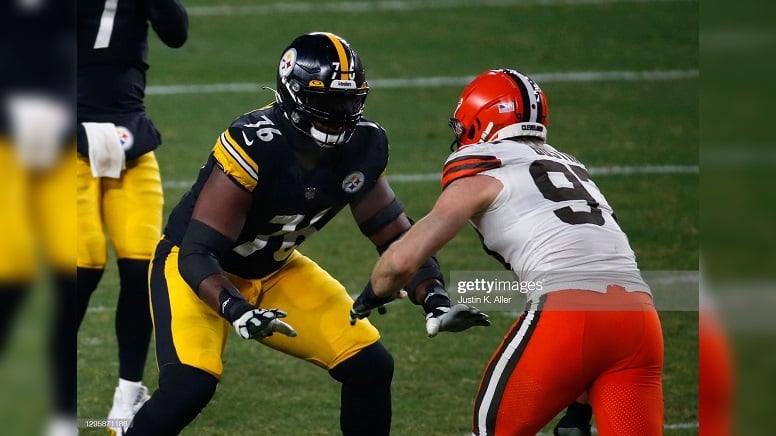
Pittsburgh Steelers tackle Chukwuma Okorafor will get a nice reward for his third NFL season due to the playing time he received.
Okorafor led all Steelers players in performance-based pay, according to numbers released by the NFL Players Association. Okorafor, who started 15 games last season, will receive an extra $567,469 for his play in 2020.
Performance-based payouts, which are designed to reward players who outperform their contracts, are deferred until 2024 because of the NFL’s reduced revenue amid the COVID-19 pandemic and are made on top of players’ base salaries. Each NFL team had a performance-based pay pool of $8.5 million for 2020, according to the report.
Okorafor, who was selected by the Steelers in the third round of the 2018 NFL Draft out of Western Michigan, played roughly 94.4% of the Steelers’ offensive snaps last season. He was one of 11 Steelers players who qualified in 2020 for a payment of more than $250,000. In total, 67 Steelers players earned some sort of performance-based pay for 2020.
According to the league, performance-based-pay is a fund that was created and used as a supplemental form of player compensation based on a comparison of playing time to salary. Players become eligible to receive a potion of the bonus distribution in any regular season in which they play at least one official down. The pay is reportedly computed by using a “player index.” To produce that index, a player’s regular-season playtime (total plays on offense, defense and special teams) is divided by his adjusted regular-season compensation (full season salary, prorated portion of signing bonus, earned incentives). Each player’s index is then compared to those of the other players on his team to determine the amount of his pay.
In case you’re curious, the extra money does not count against the Steelers salary cap as it is considered a benefit.
Below is the list of Steelers that qualified for performance-based pay for the 2020 season.
| Qualifying Player | Position | Accrued Seasons | Playtime % | Adjusted Compensation | Player Index | Percentage of Club Index | PBP Calculated Amount |
|---|---|---|---|---|---|---|---|
| Okorafor, Chukwuma | T | 2 | 94.4% | 0.7485 | 1,261,551 | 6.676% | $567,469 |
| Smith-Schuster, JuJu | WR | 3 | 79.3% | 0.585 | 1,356,329 | 5.218% | $443,518 |
| Sutton, Cameron | CB | 3 | 62.8% | 0.5055 | 1,242,492 | 4.509% | $383,244 |
| Johnson, Diontae | WR | 1 | 64.4% | 0.4802 | 1,341,817 | 4.283% | $364,074 |
| Highsmith, Alex | OLB | 0 | 60.1% | 0.4757 | 1,262,798 | 4.243% | $360,620 |
| Fitzpatrick, Minkah | SS | 2 | 93.7% | 0.4721 | 1,983,712 | 4.211% | $357,937 |
| Spillane, Robert | OLB | 1 | 45.2% | 0.4275 | 1,058,460 | 3.812% | $324,059 |
| Claypool, Chase | WR | 0 | 69.8% | 0.4251 | 1,643,025 | 3.791% | $322,239 |
| Conner, James | RB | 3 | 48.1% | 0.3892 | 1,235,032 | 3.472% | $295,087 |
| Adeniyi, Olasunkanmi | OLB | 2 | 36.4% | 0.3424 | 1,063,460 | 3.054% | $259,617 |
| Snell, Benny | RB | 1 | 40.7% | 0.3298 | 1,233,977 | 2.942% | $250,064 |
| Allen, Marcus | FS | 1 | 34.3% | 0.3238 | 1,058,460 | 2.888% | $245,500 |
| Washington, James | WR | 2 | 41.9% | 0.3002 | 1,395,946 | 2.677% | $227,565 |
| Hassenauer, J.C. | C | 0 | 30.2% | 0.2858 | 1,058,460 | 2.549% | $216,653 |
| Dotson, Kevin | G | 0 | 34.5% | 0.2832 | 1,219,428 | 2.526% | $214,691 |
| Edmunds, Terrell | SS | 2 | 78.7% | 0.2688 | 2,926,039 | 2.398% | $203,811 |
| Watt, T.J. | OLB | 3 | 77.0% | 0.2614 | 2,946,925 | 2.332% | $198,178 |
| Dangerfield, Jordan | SS | 3 | 26.7% | 0.2518 | 1,058,460 | 2.246% | $190,876 |
| Layne, Justin | CB | 1 | 32.0% | 0.248 | 1,289,005 | 2.212% | $187,983 |
| McCloud, Ray-Ray | WR | 2 | 26.3% | 0.2475 | 1,062,785 | 2.208% | $187,654 |
| Feiler, Matt | T | 3 | 77.5% | 0.2373 | 3,267,460 | 2.117% | $179,930 |
| Mondeaux, Henry | DE | 0 | 23.1% | 0.2186 | 1,058,460 | 1.950% | $165,712 |
| Pierre, James | CB | 0 | 21.4% | 0.2025 | 1,057,725 | 1.806% | $153,544 |
| Samuels, Jaylen | RB | 2 | 21.9% | 0.1946 | 1,122,976 | 1.735% | $147,515 |
| Ebron, Eric | TE | 6 | 65.9% | 0.1852 | 3,558,460 | 1.652% | $140,388 |
| Hilton, Mike | CB | 3 | 42.4% | 0.1298 | 3,267,460 | 1.158% | $98,415 |
| McDonald, Vance | TE | 7 | 47.4% | 0.1235 | 3,835,960 | 1.102% | $93,652 |
| Villanueva, Alejandro | T | 5 | 100.0% | 0.1191 | 8,398,460 | 1.062% | $90,269 |
| Alualu, Tyson | DE | 10 | 42.6% | 0.1172 | 3,633,460 | 1.045% | $88,859 |
| Elliott, Jayrone | OLB | 4 | 12.2% | 0.1159 | 1,050,000 | 1.034% | $87,855 |
| Nelson, Steven | CB | 5 | 82.1% | 0.1136 | 7,228,460 | 1.013% | $86,096 |
| Buggs, Isaiah | DE | 1 | 12.3% | 0.1121 | 1,100,618 | 1.000% | $84,995 |
| Watt, Derek | FB | 4 | 22.4% | 0.1045 | 2,140,853 | 0.932% | $79,199 |
| Pouncey, Maurkice | C | 10 | 74.0% | 0.0982 | 7,533,460 | 0.876% | $74,419 |
| Canaday, Kameron | LS | 3 | 12.5% | 0.0975 | 1,283,460 | 0.869% | $73,899 |
| Williams, Vince | ILB | 7 | 61.4% | 0.0873 | 7,037,306 | 0.779% | $66,188 |
| Heyward, Cameron | DT | 9 | 78.2% | 0.084 | 9,309,710 | 0.750% | $63,709 |
| Haden, Joe | CB | 10 | 76.5% | 0.0794 | 9,633,460 | 0.708% | $60,219 |
| DeCastro, David | G | 8 | 75.1% | 0.0766 | 9,802,200 | 0.683% | $58,056 |
| Davis, Sean | FS | 4 | 22.9% | 0.0749 | 3,056,580 | 0.668% | $56,747 |
| Hawkins, Jerald | T | 4 | 6.9% | 0.0661 | 1,050,000 | 0.590% | $50,114 |
| Gilbert, Ulysees | ILB | 1 | 6.8% | 0.0621 | 1,090,420 | 0.554% | $47,065 |
| Wormley, Chris | DE | 3 | 14.7% | 0.0619 | 2,366,121 | 0.552% | $46,949 |
| McFarland, Anthony | RB | 0 | 7.6% | 0.0617 | 1,235,333 | 0.551% | $46,803 |
| Berry, Jordan | P | 5 | 8.7% | 0.0604 | 1,433,460 | 0.539% | $45,772 |
| Bush, Devin | ILB | 1 | 24.9% | 0.058 | 4,297,498 | 0.518% | $43,989 |
| Williamson, Avery | ILB | 12 | 30.8% | 0.0559 | 5,506,580 | 0.498% | $42,352 |
| Rudolph, Mason | QB | 2 | 6.8% | 0.0524 | 1,291,526 | 0.467% | $39,736 |
| Tuitt, Stephon | DE | 6 | 76.2% | 0.051 | 14,949,210 | 0.455% | $38,632 |
| Davis, Carlos | DT | 0 | 4.8% | 0.0445 | 1,078,101 | 0.397% | $33,744 |
| Boswell, Chris | K | 5 | 11.2% | 0.0409 | 2,746,793 | 0.365% | $30,982 |
| Wisniewski, Stefen | G | 18 | 5.3% | 0.0371 | 1,433,460 | 0.331% | $28,098 |
| Roethlisberger, Ben | QB | 16 | 86.5% | 0.0364 | 23,757,520 | 0.325% | $27,618 |
| Dupree, Bud | OLB | 5 | 54.8% | 0.0346 | 15,829,880 | 0.309% | $26,264 |
| Scales, Tegray | LB | 0 | 3.4% | 0.0326 | 1,050,000 | 0.291% | $24,748 |
| Banner, Zach | T | 3 | 5.4% | 0.0307 | 1,758,460 | 0.274% | $23,274 |
| Gray, Derwin | T | 0 | 3.1% | 0.0291 | 1,058,460 | 0.260% | $22,095 |
| Brooks, Antoine | DB | 0 | 3.3% | 0.0273 | 1,225,557 | 0.243% | $20,673 |
| Edmunds, Trey | RB | 2 | 2.7% | 0.0259 | 1,058,460 | 0.231% | $19,640 |
| Gentry, Zach | TE | 1 | 2.7% | 0.0232 | 1,144,575 | 0.207% | $17,595 |
| Colquitt, Dustin | P | 30 | 3.9% | 0.0226 | 1,707,813 | 0.201% | $17,117 |
| Wright, Matthew | K | 0 | 2.2% | 0.0212 | 1,050,000 | 0.189% | $16,086 |
| Rader, Kevin | TE | 0 | 2.1% | 0.0194 | 1,058,460 | 0.173% | $14,730 |
| Marsh, Cassius | DE | 18 | 2.0% | 0.0165 | 1,194,080 | 0.147% | $12,513 |
| Cain, Deon | WR | 2 | 0.9% | 0.0081 | 1,058,460 | 0.072% | $6,137 |
| Dobbs, Joshua | QB | 3 | 0.8% | 0.0073 | 1,056,580 | 0.065% | $5,534 |
| Smallwood, Wendell | RB | 4 | 0.2% | 0.0016 | 1,050,000 | 0.015% | $1,237 |


