As I said we’d do, we’d check in on the Pittsburgh Steelers’ defense every four weeks and look at what our weekly charting says. Always good nuggets of info, even given the, shall we say, difficult state of this team and defense. So let’s dive in.
This is out of 277 plays after factoring out the no play penalties and kneeldowns.
– Personnel groupings the first month of the season.
Nickel: 112 snaps (40.4%)
Dime: 84 (30.3%)
3-4: 74 (26.7%)
3-4 (small): 6 (2.2%)
Dollar: 1 (.4%)
So to add it up, the Pittsburgh Steelers have been in sub-package a total of 197 plays. That’s just over 71% of the time. Compare that to last year when they were in sub 61% of the time. Those numbers could, and likely will, change over the rest of the season.
– The Steelers haven’t run their “over” front once this year. They did it 78 times in 2017. And did it even more in 2016.
– It’s become evident the Steelers aren’t using their personnel groupings as “cleanly” as the past. Meaning, in past years, they would play their base 3-4 against heavy personnel, nickel against 11, dime on third and long.
Not totally the case this year. There’s been many instances where the Steelers will run nickel, or even dime, against multiple tight end looks.
It’s happened 28 times already this season. How much has that hurt run defense?
Of the 11 times (lower number than I expected), they’ve been run against in this scenario, they’ve allowed 5.9 yards per carry. One of those runs was a 31 yard end around to Sammy Watkins. So if you want to take that one weird play out, the average drops to 3.4.
But! If you look at successful run rate, opponents have been successful on seven of their 11 runs. For example, the Ravens had a three yard gain on 4th and 2 last week. The average looks nice but the play was still a success for the opponent.
Considering the Steelers are allowing 7.4 yards per pass the other 17 times, five of which have been 15+ yard gains, I don’t think the idea has been super successful, even if it isn’t as disastrous as I thought it might be when they first unveiled it.
– Keith Butler’s blitz rate is an interesting one. Through the first month, he’s spiked all the way up to 42.9% of the time. All of last year, he blitzed at a 33.2% clip. His career high is 39.7% in 2016 and last year was his career low, though only barely.
He’s sent 5+ rushers 49 times this year. That’s 28%, nearly ten percent higher than 2017 (19.5%). Butler’s career high is 33.6%, set back in his first year in 2015. A number that had steadily come down with Butler and Mike Tomlin adamant about getting home with four. For now, it’s gone up to try and help out a pass rush that isn’t having as much success.
Butler has sent only three rushers 12 occasions, 6.9% of the time. Last year, he did so over 16%. Five of those instances from this year have come in the red zone, which is no surprise given how Butler has operated in the past. That’s when he’s dropping eight the most.
Let’s look at the charting position-by-position.
Defensive Line
Pressures
Stephon Tuitt: 7
Cam Heyward: 5
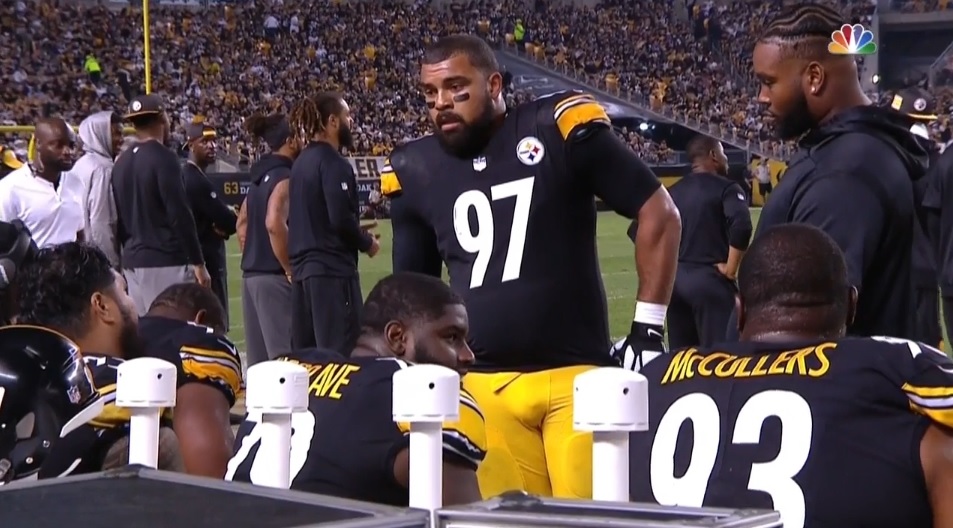
Daniel McCullers: 2
Javon Hargrave: 1
Tyson Alualu: 0
And more importantly, snaps per pressure. Lower the number, the better.
McCullers: 7.5
Tuitt: 20.6
Heyward: 30.8
Hargrave: 50
So…all of this is pretty bad. Some context should be included for McCullers, Hargrave, and Alualu. McCullers has only 15 rush snaps, Hargrave 50, and Alualu just 39. So you wouldn’t expect gaudy numbers from any of those three but still, the lack of production is terrible.
The real concern is with Tuitt and Heyward. Both players have rushed over 140 snaps but their “snaps per pressure” have basically doubled for each of them compared to last season. Since the Cleveland game, they’ve combined for only five pressures. And there’s just a single sack between them.
I want to look into it closer but I wonder if Karl Dunbar has changed how these guys rush. Feels a little more rigid this year, a focus on QB containment (that’s been a problem for awhile now), and more stunting to free up the OLBs so they can earn their money.
– Heyward has played 82.6% of the time. Tuitt a little lower at 77.6%.
– Due to L.T. Walton being inactive when the group is healthy, Hargrave has played four snaps as a base 3-4 defensive end. He’s the left end.
Outside Linebacker
Pressures
Bud Dupree: 16
T.J. Watt: 13
Jon Bostic: 4
Anthony Chickillo: 3
Vince Williams: 3
And same thing as the d-line. Snaps per pressure.
Bostic: 4.8
Dupree: 7.7
Watt: 9.8
Chickillo: 11.8
Williams: 17.3
Much better numbers here. Every single one of the linebackers is outproducing Heyward and Tuitt on a per pressure basis. Quality of pressures is a different thing the stats won’t show but hey, pressure is pressure, and you take what you can get right now.
Watt is in a very similar place as last year, when he averaged a pressure once every 9.6 snaps. Dupree was at 12.5 last year so a nice increase for him here. Chickillo has come down too but his sample size is small – just 35 pass rushes.
Bostic has 19 pass rushes. Williams is much higher at 52, though he’s also simply playing more snaps than Bostic. That’s why he’s had more chances. Williams also lines up as an OLB often. Bostic hasn’t done it at all.
Now for the always interesting drop % from the OLBs.
Dupree: 21.7%
Chickillo: 22.2%
Watt: 24.7%
Has evened out across the board. Watt is way down from his 37.3% of 2017. Dupree down a little from 25% while Chickillo finished things out at 27% last season.
Which means for the first time under Butler, the LOLB is dropping more than the right. They’re letting Dupree rush the passer more, playing to what he’s better at (even if he’s far from perfect).
– Coverage/target numbers, though sample sizes are small for all of these guys.
Bostic: 2/5 50 yards 0 TD, 1 INT
Williams: 1/1 15 yards
Dupree: 1/2 13 yards 0 TD, 1 INT
Watt: 2/3 30 yards
That Bostic INT, by the way, is credited to him because of the deflection he had versus Tampa Bay. He made the play so he gets the pick, not Mike Hilton. That’s consistent with how we’ve done things in the past.
Secondary
– Let’s hit up target numbers since they’re the thing most of us – myself included – are interested in.
Joe Haden:5/13 76 yards 1 TD, 0 INT
Artie Burns:10/12 204 yards 3 TDs, 0 INT
Coty Sensabaugh: 6/10 87 yards 1 TD, 0 INT
Mike Hilton: 4/9 92 yards 0 TD, 0 INT
Cam Sutton: 4/7 70 yards 1 TD, 1 INT
Terrell Edmunds: 2/4 80 yards 0 TDs, 1 INT
Nat Berhe: 2/2 26 yards 0 TD, 0 INT
Morgan Burnett: 1/1 25 yards 1 TD, 0 INTs
So when teams are targeting anyone in the secondary not named Haden or Hilton, they’re completing 25/36 (69.4%) of their passes for 492 yards (13.7 yards per attempt), 6 touchdowns, and two interceptions.
When they’re targeting Haden and Hilton, they’re completing 9/22 (40.9%) of their passes for 168 yards (7.6 yards per attempt), 1 touchdown, and no interceptions.
To sum up, the QB rating when targeting the first group? 128.5.
Haden and Hilton? 83.1.
That second one might not be great but it looks like Mel Blount compared to the rest.
– Cam Sutton has blitzed seven times this season. He’s yet to record a single pressure.
– Sean Davis and Hilton are tied for the secondary lead with two pressures each.


