With four games completed, it is a suitable time to take a look at the offense and see how it is performing. Specifically, in this article, I wanted to look at the use of the Pittsburgh Steelers’ personnel groups with one tight end versus multiple tight ends.
Per our charting, this offense has run 229 total plays. Removing penalties, kneel downs and aborted plays leaves us with a total of 204. A personnel group with multiple tight ends (two, three or four) has accounted for 128 of those plays or 62.7 percent of the plays. Two tight end sets have accounted for half of their offensive plays, and they may have found a good pairing of particular tight ends. More on that later.
So, which is more successful? Let’s take a look at the numbers.
Total Offense
The most successful of the multiple tight end groupings is 12 personnel, averaging 4.31 yards per play.
| Grouping | Play Count | Net Yards | Average per Play |
| 04 (4 TE’s) | 2 | -7 | -3.50 |
| 12 (2 TE’s) | 102 | 440 | 4.31 |
| 13 (3 TE’s) | 23 | 75 | 3.26 |
| 14 (4 TE’s) | 1 | 2 | 2.00 |
| Grand Total | 128 | 510 | 3.98 |
Four yards per play for the Arthur Smith multiple-tight-end offense. And the single tight end offense was better at over seven yards per play.
| Grouping | Play Count | Net Yards | Average per Play |
| 11 (1 RB, 1 TE) | 69 | 513 | 7.43 |
| 21 (2 RB, 1 TE) | 7 | 32 | 4.57 |
| Grand Total | 76 | 545 | 7.17 |
Passing Offense
The commitment to multiple tight ends isn’t just about running the ball. The Steelers threw the ball 55 percent of the time with multiple tight ends averaging a touch over four yards per play.
| Grouping | Play Count | Net Yards | Average per Play |
| 04 | 2 | -7 | -3.50 |
| 12 | 57 | 251 | 4.40 |
| 13 | 11 | 48 | 4.36 |
| 14 | 1 | 2 | 2.00 |
| Grand Total | 71 | 294 | 4.14 |
As you might expect, throwing the ball with just one tight end on the field yielded better results.
| Grouping | Play Count | Net Yards | Average per Play |
| 11 | 46 | 429 | 9.33 |
| 21 | 4 | 27 | 6.75 |
| Grand Total | 50 | 456 | 9.12 |
Nine yards per play in 11 personnel, a grouping used just 38 percent of the passing plays, begs the question. Why not use it more?
Running Offense
This has not been a strong suit to this point in the season, but the running game looked better in week four. The use of twelve personnel has been the most productive, being the only grouping to garner over four yards per play.
| Grouping | Play Count | Net Yards | Average per Play |
| 12 | 45 | 189 | 4.20 |
| 13 | 12 | 27 | 2.25 |
| Grand Total | 57 | 216 | 3.79 |
However, the single tight end running game has not been far behind. The difference between multiple tight ends and a single tight end running play is about a third of a yard. Running the ball is an area they need to continue to improve.
| Grouping | Play Count | Net Yards | Average per Play |
| 11 | 23 | 84 | 3.65 |
| 21 | 3 | 5 | 1.67 |
| Grand Total | 26 | 89 | 3.42 |
Red Zone Offense – All Plays
So far this season, production near the end zone has been significantly improved under the leadership of Aaron Rodgers. And multiple tight end looks have dominated the play selection despite a low per-play average.
| Grouping | Play Count | Net Yards | Average per Play |
| 04 | 1 | -10 | -10.00 |
| 12 | 19 | 85 | 4.47 |
| 13 | 9 | 13 | 1.44 |
| 14 | 1 | 2 | 2.00 |
| Grand Total | 30 | 90 | 3.00 |
Even if you remove the sack with four tight ends on the field, the average play is still only 3.44 yards. Twelve personnel have been productive, and seven of the nine touchdowns in the red zone have come with multiple tight ends on the field. That is a 23 percent touchdown rate on the 30 plays in the red zone.
The eleven-personnel group has produced a better per-play average and two touchdowns in the red zone. This touchdown rate is 22 percent.
| Grouping | Play Count | Net Yards | Average per Play |
| 11 | 9 | 59 | 6.56 |
Red Zone Passing
Forty percent of the time, the team has thrown the ball when in the red zone with multiple tight ends on the field, with twelve personnel again being most successful in per-play average. Six total touchdowns have been thrown, three coming in twelve personnel and one in thirteen.
| Grouping | Play Count | Net Yards | Average per Play |
| 04 | 1 | -10 | -10.00 |
| 12 | 7 | 43 | 6.14 |
| 13 | 3 | 8 | 2.67 |
| 14 | 1 | 2 | 2.00 |
| Grand Total | 12 | 43 | 3.58 |
Eleven personnel have gained almost nine yards per play passing in the red zone and 2 touchdowns.
| Grouping | Play Count | Net Yards | Average per Play |
| 11 | 5 | 44 | 8.8 |
Red Zone Running
The confines of running in the red zone have not been as successful as one would hope in any personnel group. However, half of the 13 personnel runs have produced touchdowns.
| Grouping | Play Count | Net Yards | Average per Play |
| 12 | 12 | 42 | 3.50 |
| 13 | 6 | 5 | 0.83 |
| Grand Total | 18 | 47 | 2.61 |
The one tight end look has produced a better yards per play average in limited usage.
| Grouping | Play Count | Net Yards | Average per Play |
| 11 | 4 | 15 | 3.75 |
The Secret Weapon?
The Steelers may have found something in week four, using offensive lineman Spencer Anderson lined up as a tight end. Prior to week four, they had used him on three plays as a tight end. A successful two-point conversion versus Seattle and two plays against New England, with each of those plays being 15-yard gains through the air.
Against Minnesota, Pittsburgh went big with Anderson and Darnell Washington seventeen times, with one of those plays nullified by a penalty. Twelve of those plays yielded four or more yards, ten were for six yards or more and six were for at least nine yards.
Total Plays with Anderson at TE
| Grouping | Play Count | Net Yards | Average per Play |
| 12 | 12 | 77 | 6.42 |
| 13 | 6 | 51 | 8.50 |
| 14 | 1 | 2 | 2.00 |
| Grand Total | 19 | 130 | 6.84 |
Average yards per play got a big boost in most situations with Anderson on the field.
All Passes
| Grouping | Play Count | Net Yards | Average per Play |
| 12 | 4 | 27 | 6.75 |
| 13 | 2 | 30 | 15.00 |
| 14 | 1 | 2 | 2.00 |
| Grand Total | 7 | 59 | 8.43 |
Red Zone Passes
| Grouping | Play Count | Net Yards | Average per Play |
| 12 | 1 | 11 | 11 |
| 14 | 1 | 2 | 2 |
| Grand Total | 2 | 13 | 6.5 |
All Runs
| Grouping | Play Count | Net Yards | Average per Play |
| 12 | 8 | 50 | 6.25 |
| 13 | 4 | 21 | 5.25 |
| Grand Total | 12 | 71 | 5.92 |
Red Zone Runs
| Grouping | Play Count | Net Yards | Average per Play |
| 12 | 3 | 17 | 5.67 |
| 13 | 2 | 6 | 3.00 |
| Grand Total | 5 | 23 | 4.60 |
Conclusion
From what the numbers show, across the board, with the exception of overall running, the single tight end offense has produced a better per-play average than the multiple tight end sets. However, seven of the eleven touchdowns have come with multiple tight ends on the field.
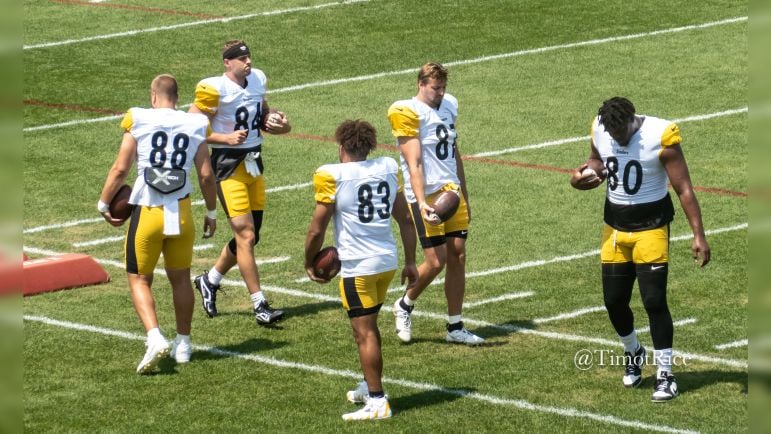
We’re still waiting for Pat Freiermuth and Jonnu Smith to find their respective roles within this offense, which would boost the multiple-tight-end production.
The use of Anderson and Washington has shown to be very productive and we are guaranteed to see more of that and possibly with a few additional wrinkles.
Based on the numbers, you would think there could be an uptick in 11 personnel usage. Probably not this week with Calvin Austin out, but down the road. It’s hard to see Smith going away from his true love, though.
This offense is still finding its way with Rodgers at the helm, and we would expect (and hope) to see improvement in all areas. This is where they stand a quarter of the way through the season, and they have plenty of room to grow. We shall see if the arrow is pointing up going forward.