Today, I wanted to provide the other side of the coin to my Steelers’ Quarterback Passing Charts, looking at and providing takeaways for Pittsburgh’s receivers for the 2024 regular and postseason.
A couple of notes before we jump in. Thanks to Thomas Mock for his great work, which helped me learn much of what I’m using in the series visually. Spikes and clear throwaways are removed because they are the correct situational decisions, along with batted passes at the line of scrimmage that affect the intended pass location.
First, let’s look at WR completion/incompletion dots, then discuss targets, catches, and catch rates along with team ranks (seven qualifiers, min. 25 targets):
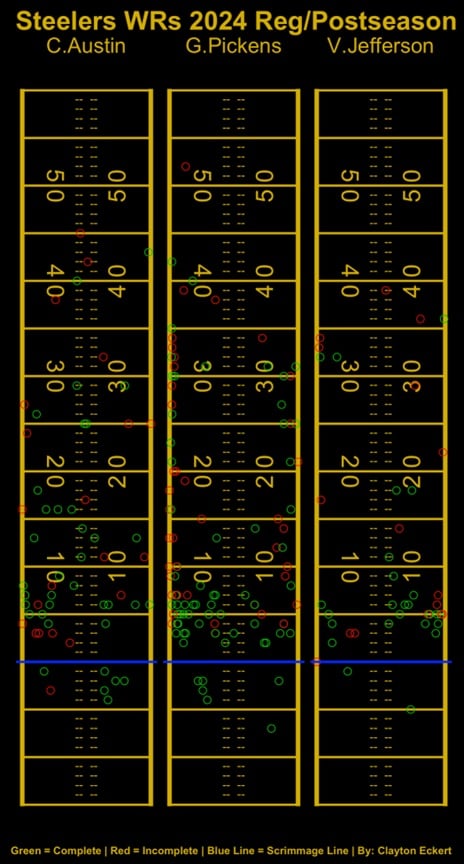
George Pickens-Charted-Targets: 106 (first). Catches: 65 (second). Catch-Rate: 61.3-percent (last).
Pickens led the team in targets, as you probably knew. Second in catches, though, with the lowest catch rate of all Steelers receivers with at least 25 charted targets. This, and the visual above, point to being the team’s primary downfield target, with that high volume of lower percentage throws going his way. Nine drops were also an issue (T-seventh most in the NFL).
Calvin Austin-Charted-Targets: 58 (third). Catches: 37 (fifth). Catch-Rate: 63.8-percent (fifth).
He had much more opportunity this season, nearly double the charted targets he saw in 2023 (30). The quality also got better through the season. Austin moved up a rank in catches, and his connection with QB Russell Wilson improved from 56-percent to a 63.8 catch rate post-bye. Here’s to hoping that momentum carries into 2025, with production behind WR1 needing a boost.
Van Jefferson-Charted-Targets: 42 (sixth). Catches: 26 (sixth). Catch-Rate: 61.9-percent (sixth).
Speaking of which, the third most targeted WR in Jefferson was more useful as a blocker and was primarily a short-area target. The visual emphasizes that the past ten yards were less than ideal overall, and hopefully, scheme/depth improvements can aid a room that challenges defenses more.
Here’s a heat map of completions only, followed by completion rates by pass distance:
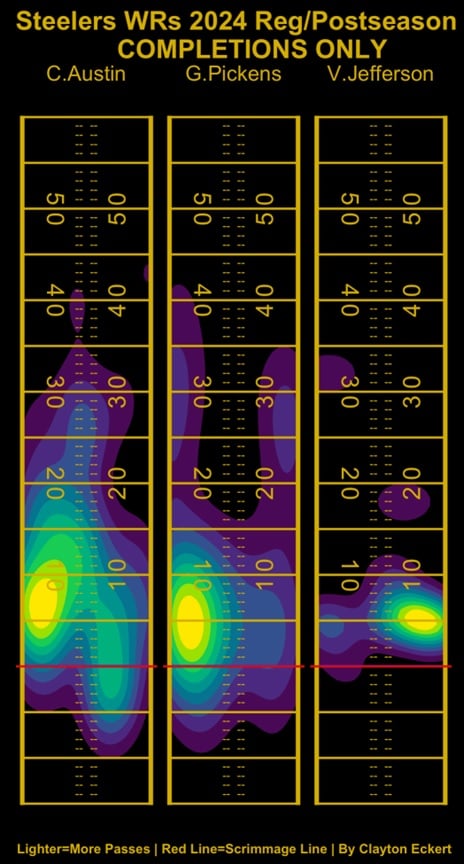
There is predictability for each, which the opposition picked up on in the five-game losing streak to end of 2024. Outside of high percentage short throws, it was largely Pickens deep to the sidelines, Austin over the middle and intermediate, and only a sprinkle of success past ten yards for Jefferson.
Pickens-Behind-the-line: 6/6 (100-percent). 0-5 air-yards: 22/28 (78.6-percent). 5-10 air-yards: 21/34 (61.8-percent). 10-15 air-yards: 4/13 (30.8-percent). 15-20 air-yards: 2/9 (22.2-percent). Explosive: 17/32 (53.1-percent).
Intermediate (10-20 yards) was an extreme struggle for Steelers quarterbacks that also lacked quantity. This is very true for Pickens on the receiving end as well. Improving on this would challenge defenses more, as they figured out Wilson’s short or chunk it deep style. Knock on wood, we see a change, regardless of who’s the starting quarterback in 2025.
Austin-Behind-the-line: 6/7 (85.7-percent). 0-5 air-yards: 4/9 (44.4-percent). 5-10 air-yards: 13/16 (81.3-percent). 10-15 air-yards: 5/7 (71.4-percent). 15-20 air-yards: 4/6 (66.7-percent). Explosive: 7/15 (46.7-percent).
Those are pretty strong rates for Austin overall, who was the exception and Pittsburgh’s best intermediate wide receiver this season. 0-5 air yards was an unfortunate room for improvement area. Much better explosive results compared to an abysmal 14.3 catch rate last year. Hoping for another jump in year three.
Jefferson-Behind-the-line: 2/2 (100-percent). 0-5 air-yards: 12/17 (70.6-percent). 5-10 air-yards: 12/17 (70.6-percent). 10-15 air-yards: 1/2 (50-percent). 15-20 air-yards: 2/3 (66.7-percent). Explosive: 3/9 (33.3-percent).
Once again, the numbers highlight strong short-area results, rare intermediate opportunities, and an overall lack of explosive impact, which isn’t Jefferson’s game.
Now for non-WRs, starting with dots and team ranks (eight qualifiers, min. 25-targets):

TE Pat Freiermuth: Charted-Targets: 77 (second). Catches: 67 (first). Catch-Rate: 87-percent (first).
Freiermuth encouragingly was more involved in Pittsburgh’s offense, leading Pittsburgh in catches and catch rate. Overall, it was largely ten yards or less, and all incompletions past that mark were between the numbers. The position was rarely utilized at 20-plus air yards, an untapped resource that Freiermuth should be getting more opportunities as we see from some of the most successful NFL offenses.
RB Jaylen Warren: Charted-Targets: 50 (T-fourth). Catches: 43 (third). Catch-Rate: 86-percent (second).
The position is largely used as a check-down option for their QBs across the league, and Warren was the more reliable one for Pittsburgh in 2024. The vast majority was less than five air yards but did have three targets of five-plus.
RB Najee Harris: Charted-Targets: 50 (T-fourth). Catches: 39 (fourth). Catch-Rate: 78-percent (fourth).
Harris tied Warren in charted targets, only behind Pickens and Freiermuth. We see Harris had the worse catch rate, though, eight percentage points worse. This included focus drops despite all of his targets coming at five yards or less and the majority of incompletions behind the line.
TE Darnell Washington: Charted-Targets: 25 (last). Catches: 20 (last). Catch-Rate: 80-percent (third).
Though Washington ranked last in targets and catches in his second season, his involvement more than doubled his rookie year (ten targets, seven catches). Similar to Freiermuth, it’s mostly ten air yards or less. He did contribute some nice things in the intermediate range, but he only had one explosive air yard target.
Now the heat map for completions only and completion rates by pass distance:
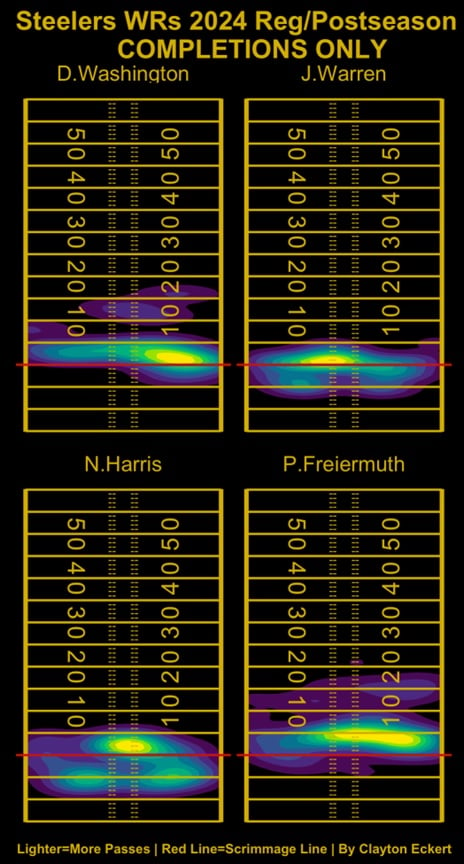
As I stated earlier, the charts are pretty bleak overall, particularly for the tight ends. Of course, wide receiver charts should be much more varied, but less predictability and likely increased impact at TE around the field could do wonders in 2025.
Freiermuth-Behind-the-line: 4/4 (100-percent). 0-5 air-yards: 43/47 (91.5-percent). 5-10 air-yards: 20/24 (83.3-percent). 10-15 air-yards: 8/13 (61.5-percent). 15-20 air-yards: 5/7 (71.4-percent). Explosive: 1/1 (100-percent).
Stellar rates overall, with 60-plus percent at all pass distances, impressively. Over 80 at ten air yards or less, with 10-15 being an area for hopeful improvement.
Warren-Behind-the-line: 17/20 (85-percent). 0-5 air-yards: 26/28 (92.9-percent). 5-10 air-yards: 1/2 (50-percent). 10-15 air-yards: 0/0. 15-20 air-yards: 0/1 (0-percent). Explosive: 0/0.
Great check-down results, but connections on just one of three targets past five yards.
Harris-Behind-the-line: 21/29 (72.4-percent). 0-5 air-yards: 18/21 (85.7-percent). 5-10 air-yards: 0/1 (0-percent). 10-15 air-yards: 0/0. 15-20 air-yards: 0/0. Explosive: 0/0.
Lower marks than Warren across the board, which doesn’t bode well, considering the team could move on.
Washington-Behind-the-line: 2/3 (66.7-percent). 0-5 air-yards: 14/15 (93.3-percent). 5-10 air-yards: 2/4 (50-percent). 10-15 air-yards: 2/3 (66.7-percent). 15-20 air-yards: 1/1 (100-percent). Explosive: 0/1 (0-percent).
0-5 air yards was near perfect and the majority of his opportunities, the best rate on the team outside of behind the line and reasonable volume. It will be interesting to see what his 2025 utilization looks like, along with the entire Steelers receiving corps.
Many questions remain early in the offseason. One thing’s for sure: Something has to give with how the 2024 season ended. It is discouraging to see how far Pittsburgh is from several prolific offenses in today’s NFL.
The Steelers have had their way of doing things, with a run-first and strong defensive mentality. A painful five-game losing streak against strong teams to end the year will hopefully prompt a long-overdue bolstering of their pass game to complement that even more.