Today I wanted to continue the series, looking at NFL tight ends receiving stats. The Pittsburgh Steelers added MyCole Pruitt this offseason, who has a rapport with new OC Arthur Smith in both of his prior coaching stops in Atlanta and Tennessee.
The stats in this study are from the 2023 season, focusing on Pruitt and current Steelers for comparison. The goal is to see how they stacked up against their peers across the NFL and what that could mean for 2024.
Let’s dive in, starting with on target catch percentage (total receptions/number of catchable targets) which highlights the quality of targets and connectivity, along with drop percentage (drops/catchable targets) to see who made the most of their expected catch situations:
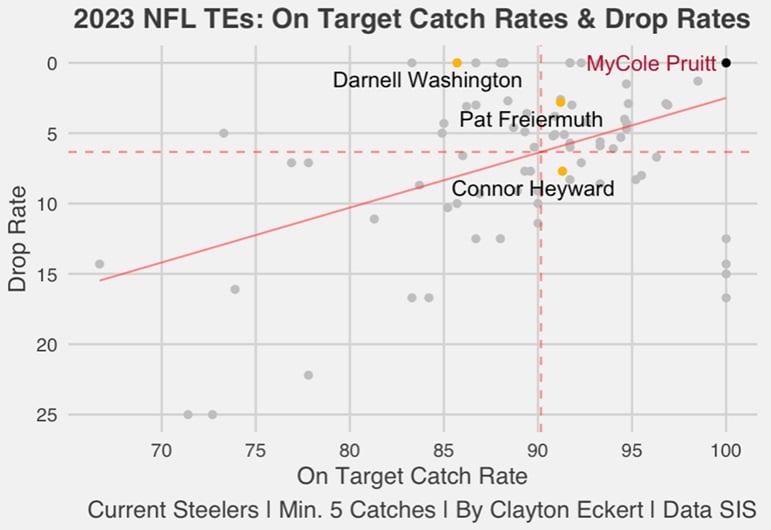
Here we see Pruitt lands impressively on the most ideal plot point of the visual, tying for first with several players at the extreme top right with a 100-percent on target catch rate and zero percent drop rate.
In order to evaluate Pruitt’s 2023 season as a receiver though, I included all tight ends with a minimum of five catches, leaving 87 qualifying TEs. Pruitt had just nine catches on 12 targets last season, so while the data above is encouraging, it’s much easier to achieve on a smaller sample size such as his.
Here are 2023 target and catch numbers and ranks for further context:
Pat Freiermuth: 46 targets (T-27th), 32 catches (T-29th).
Connor Heyward: 33 targets (T-41st), 23 catches (T-42nd).
MyCole Pruitt: 12 targets (T-73rd), nine catches (T-70th).
Darnell Washington: 10 targets (77th), seven catches (T-78th).
Pruitt’s opportunities were much closer to a man like Washington, who many were clamoring to get more targets last season and moving forward. Washington had a matching zero drops in his low volume receiving usage his rookie year, but had a much lower and only Steeler with a below the mean 85.7 on-target catch rate (T-69th).
Then, Freiermuth landed above the line in each. His 2.8 drop rate (24th) is great given his higher usage, though he was limited to only 12 games. Barring another injury, hopefully that quality remains with an expected uptick in targets. A 91.2 on target catch rate tied for a lower 42nd, and points to an area of hopeful improvement with the new QB situation in 2024.
Heyward was in the middle of the pack in opportunity. I expect opportunities to go down despite Smith’s usage of multiple TEs, lacking the ideal body type of most blocking TEs and health of Freiermuth. The caveat could be versatility to play more receiver alignments sans a true WR2. In 2023, Heyward had a 91.3 on target catch rate (41st, just above Freiermuth), but the only below-average 7.7 drop rate of players in our sights (T-57th).
Next, let’s look at yards per route run (YPRR=total receiving yards/number of routes run excluding RPO handoffs) and yards per target (YPT=receiving yards per pass attempt in which the receiver is targeted, including incompletions) to get an idea of how the players were utilized:
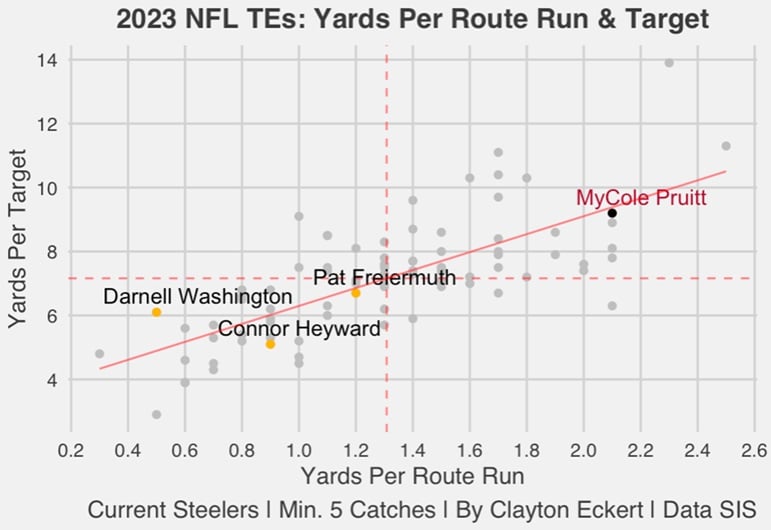
Once again, we see a favorable plot point for Pruitt. Well above the mean in each, his 2.1 YPRR tied for an impressive third-best of the 87 qualifiers, along with 9.2 YPT landing ninth. So, Pruitt was in the top ten in both garnering more opportunities downfield, but also important to recall his low usage compared to his peers.
The results were quite different for Pittsburgh, all landing below-average. Freiermuth was the best of that group with a 1.2 YPRR (T-51st) and 6.7 YPT (T-56th). Yes, targeting TEs in the shorter range of the field are high percentage plays, but I’m really hoping those numbers go up with Smith and the new QB room.
Heyward was next in YPRR at just 0.9 (T-66th), and 5.1 YPT (78th). Then, Washington had a very low 0.5 YPRR (T-85th), second-least among qualifiers, and a better 6.1 yards per target (65th). Overall, they were targeted on short area leak outs and flat routes, and hopefully Steelers TEs can be unleashed more regularly in Smith’s offense.
Let’s further examine their usage with average depth of target (ADOT=average distance downfield that the targeted throws traveled, excluding spikes and throwaways) and average depth of completion (ADOC) to zero in on opportunities more in the receiver’s control:
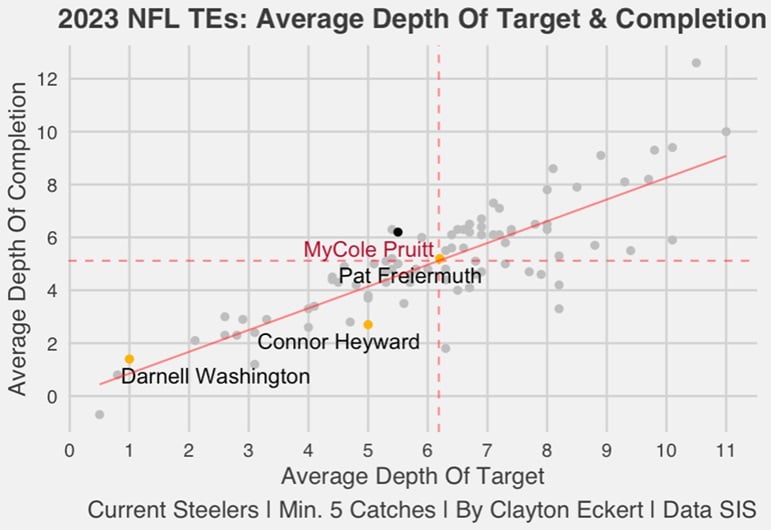
Pruitt tops focused players in another category, with a 6.2 ADOC that tied for 23rd. If forced to choose, that’s the more ideal number for a receiver, compared to his below the mean 5.5 ADOT (T-56th). So, Pruitt cashed in on his deepest targets better than the players in our sights, encouragingly.
Freiermuth lands right at the mean in both data points. His 6.2 ADOT led all focused players and ranked 49th, along with a 5.2 ADOC (T-39th). The other two Steelers TEs were well below the mean in each.
Particularly Washington, whose extremely low 1.0 ADOT was third-least among qualifiers (85th), and a 1.4 ADOC that ranked 84th (fourth-least). In comparison, Heyward had a notably higher 5.0 ADOT (T-65th), but with that came less connection unfortunately (2.7 ADOC, 77th).
Continuing with more important factors, here are first down percentages (percentage of receptions where the receiver achieved a first down) along with broken/missed tackles per reception (BMT), a fun and telling data point. The goal here is to see who provided moving the chains plays and which players also showed the ability to make guys miss:
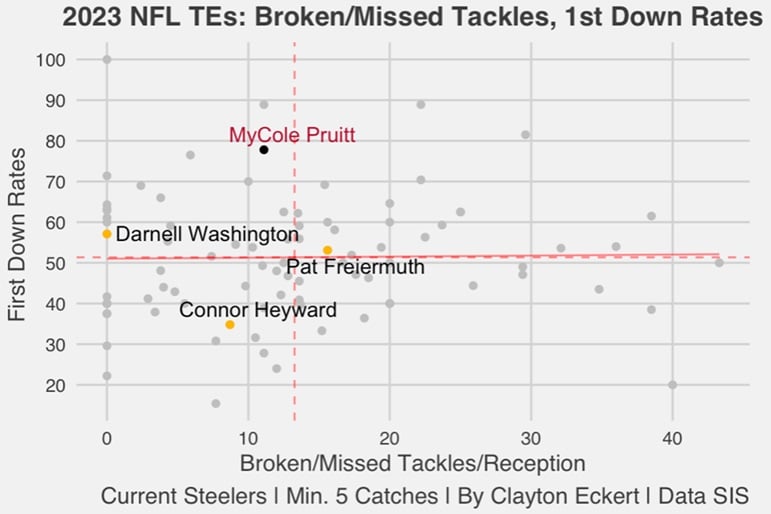
While Pruitt’s 11.1 BMT number was below-average (T-47th), he had a rather impressive fifth-ranked 77.8 first down rate. The latter makes sense given his ADOT and ADOC in the previous view, providing nice quality over quality that included moving the chains.
Another low usage player in Washington had an above the mean 57.1 first down rate (40th) despite surprisingly having no broken/missed tackles given his large stature. Freiermuth landed above the mean in each, barely with a 53.1 first down rate (40th), while he fared better in BMT (15.6) that tied for 30th and led current Steelers. Heyward was below the mean in each again, with an 8.7 BMT (57th) and poor 34.8 first down rate (78th).
Here are completed air yard percentages (CAY) along with yards after catch rates (YAC) to see context of how yardage came:
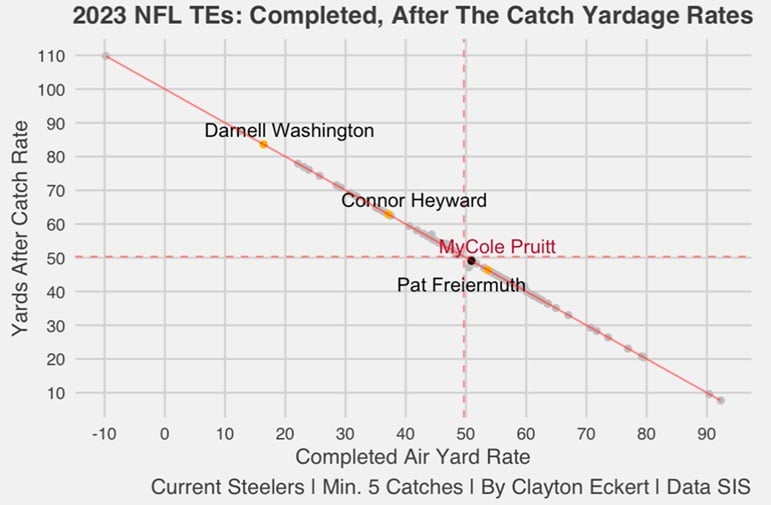
Players with more YAC than completed air yards land on the top left, such as Washington and Heyward, while TEs on the bottom right saw more of their yardage come through the air.
Washington’s splits were 83.6 YAC (third-most) compared to just 16.4 CAY. Heyward had 62.9 in YAC (18th), compared to 37.1 CAY (70th). Freiermuth had the highest 53.6 CAY of highlighted TEs (38th), compared to 46.4 in YAC (50th). Pruitt lands virtually at the mean, with 50.9 CAY (45th) and 49.1 in YAC (43rd), the best balance of 2024 Steelers.
I also wanted to provide a total value view using points earned per route (The total of a player’s EPA responsibility on routes run using the total points system that distributes credit among all players on the field for a given play. Totals are scaled up to map to the average points scored or allowed on a team level, with the player’s snap count determining how much to adjust.
For receivers, this includes accounting for offensive line play, off-target passes, dropped passes, and broken tackles. Values are modulated using a quality-of-competition multiplier based on each opponent’s previous year of performance) and EPA per target (the total change in the offense’s expected points that came on passes thrown to the player):
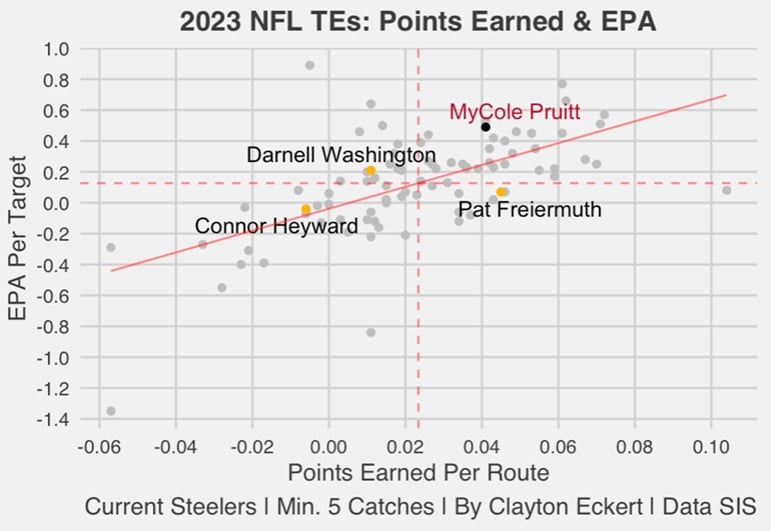
In this more total view, Pruitt was the only current Pittsburgh TE to land above the mean in each data point. He tied for 25th in points earned (just below Freiermuth), but was particularly strong in EPA, ranking ninth-best out of the 87 qualifying TEs. This emphasizes the quality over quantity point that came up throughout the article, that Pruitt can hopefully provide assuming he makes the team and earns playing time.
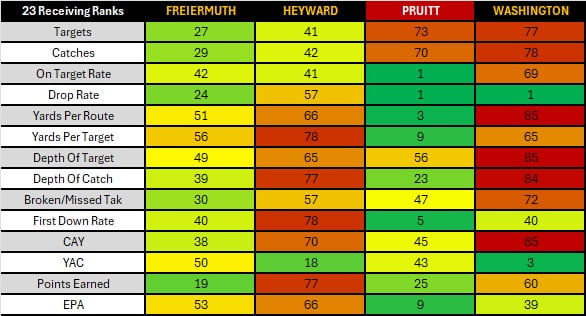
To close, here is a table of all the ranks: