
Today I wanted to provide the other side of the coin to my weekly Steelers Quarterback Passing Chart articles, looking at and providing takeaways for Pittsburgh’s receivers for the 2023 regular and postseason.
A couple of notes before we jump in. Thanks to Thomas Mock for his great work that helped me learn much of what I’m using in the series visually. Spikes and clear throwaways are removed due to being the correct situational decision along with batted passes at the line of scrimmage that affect the intended pass location.
First, let’s look at the top four WRs completion/incompletion dots, then discuss targets, catches, and catch rates along with team ranks (eight qualifiers, min. 25 targets):
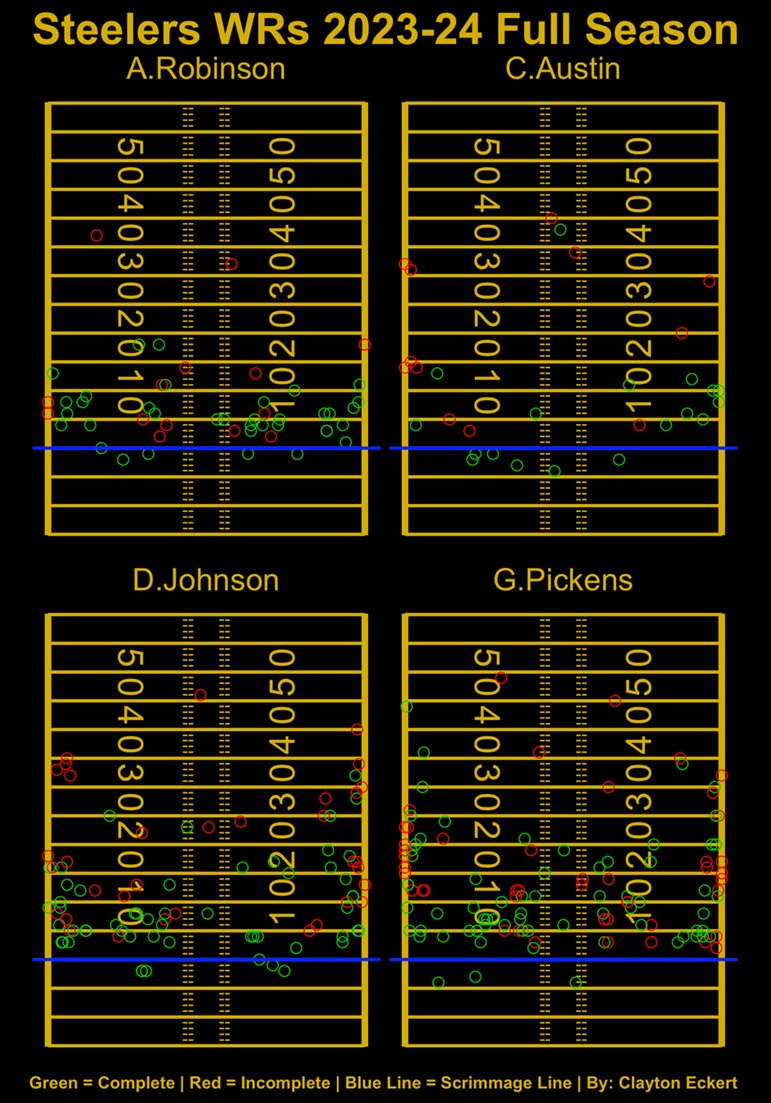
George Pickens — Charted Targets: 115 (first). Catches: 68 (first). Catch Rate: 59.1 percent (last).
Pickens still led the team in targets and catches on the lowest catch rate. This wasn’t a downtrend on his part with virtually the same catch rate as my last receivers article through Week 14 but encouraging upticks from others.
Diontae Johnson — Charted Targets: 92 (second). Catches: 55 (third). Catch Rate: 59.8 percent (seventh). One example of the last point is Johnson, whose catch rate improved from 56.1 percent in the final five games, encouraging at the second-highest volume.
Allen Robinson II — Charted-Targets: 51 (fifth). Catches: 36 (fifth). Catch Rate: 70.6 percent (T-fourth). Another player with an improved catch rate to close the year, from 67.5 percent previously.
Calvin Austin III — Charted-Targets: 30 (last). Catches: 18 (last). Catch Rate: 65.4 percent (sixth). Only four targets and one catch the last four games. His lack of involvement was frustrating, with pitiful slot-receiver production.
Here’s heat maps of all targets, then completion rates by passing distance:
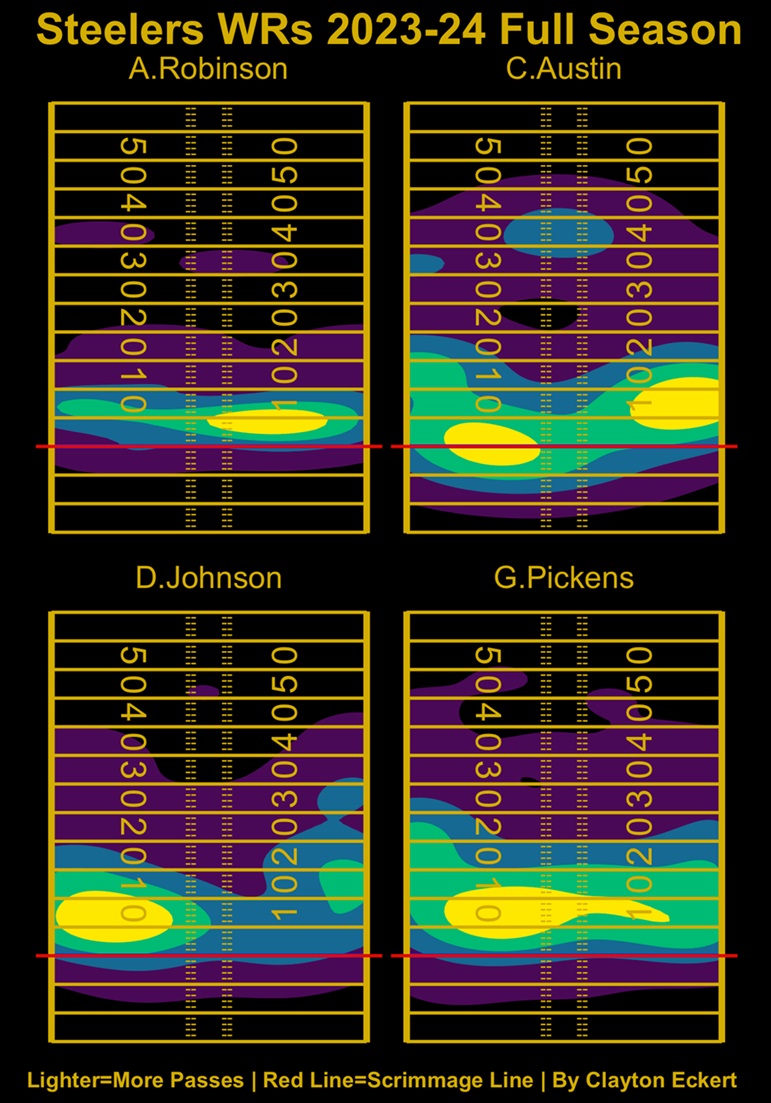
Pickens — Behind the line: 3/3 (100 percent). 0-5 air yards: 18/26 (69.2 percent). 5-10 air yards: 25/32 (78.1 percent). 10-15 air yards: 12/28 (42.9 percent). 15-20 air yards: 11/22 (50 percent). Explosive: 14/27 (51.9 percent).
Every completion rate rose or stood pat, except for explosives, Pickens going from 52.6 percent to 51.9 the last five games. He impressively led the team in that regard on the highest volume.
Most frequent was 0-10 air yards with his highest catch rate at 5-10 air yards. Pickens’ had the lowest catch rate among Steelers WRs at 10-15 air yards.
Johnson — Behind the line: 5/5 (100 percent). 0-5 air yards: 19/23 (82.6 percent). 5-10 air yards: 18/27 (66.7 percent). 10-15 air yards: 8/16 (50 percent). 15-20 air yards: 8/14 (57.1 percent). Explosive: 5/19 (26.3 percent).
His catch rate at 0-5 air yards improved from 75 percent to an impressive 82.6 percent to close the season, along with over a 10-percent increase at 15-20 air yards. Explosives were painful all season though, at the second-most targets.
Robinson — Behind the line: 4/4 (100 percent). 0-5 air-yards: 15/20 (75 percent). 5-10 air-yards: 16/20 (80 percent). 10-15 air-yards: 4/7 (57.1 percent). 15-20 air-yards: 2/4 (50 percent). Explosive: 0/2 (0-percent).
Wasn’t targeted past 15 air yards in the final stretch of the year, stood pat in completion rates at five yards or less, and saw upticks from five to 15 air yards. No explosive catches this year and limited intermediate opportunities as well.
Austin — Behind the line: 6/6 (100 percent). 0-5 air-yards: 3/6 (50 percent). 5-10 air-yards: 6/7 (85.7 percent). 10-15 air-yards: 5/8 (62.5 percent). 15-20 air-yards: 0/2 (0 percent). Explosive: 1/7 (14.3 percent).
Only four targets the last five games, including two explosive incompletions for an abysmal 14.3 explosive completion rate. Best result was 5-10 air yards (85.7 percent), leading the top four receivers on the least number of targets. Austin led WRs in behind-the-line targets where the group had perfect catch rates.
NOTE: Austin’s heat maps are generously wide considering his low targets, comparatively.
Here’s the completions-only heat map:
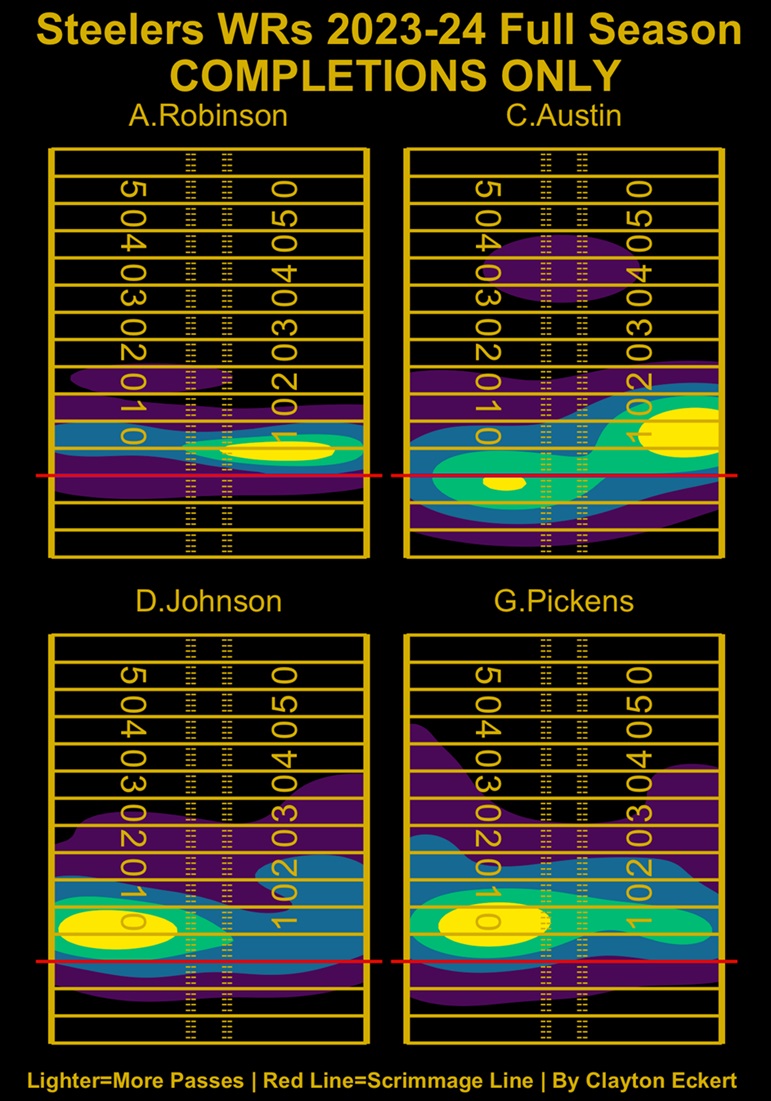
The last point is important when viewing Austin’s completions-only chart. That large downfield dot was one catch, the Week Three triple-explosive touchdown (38 air yards). Only one completed air distance topped that, a 44-air-yarder to Pickens in Week 16. Just six double-explosive air-yard attempts (40-plus yards) with the play to Pickens the only completion (one-of-six, 16.7 percent).
Pickens — Most targeted area: center to outside the numbers at 3-12 air yards (left particularly). Most completed area: left hash to outside the left numbers at 3-11 air yards.
Johnson — Most targeted area: outside left hash to left sideline at 3-12 air yards. Most completed area: outside left hash to left sideline at 3-9 air yards.
Robinson — Most targeted area: center to outside right numbers at 2-7 air yards. Most completed area: right hash to outside right numbers at 3-6 air yards.
Austin — Most targeted area: left hash to outside left numbers behind the line to 6 air yards and right numbers to right sideline at 3-12 air yards. Most completed area: right numbers to right sideline at 3-13 air yards and behind the line between left hash and numbers.
Now for non-WRs, starting with dots and team-ranks (eight-qualifiers, min. 25-targets):
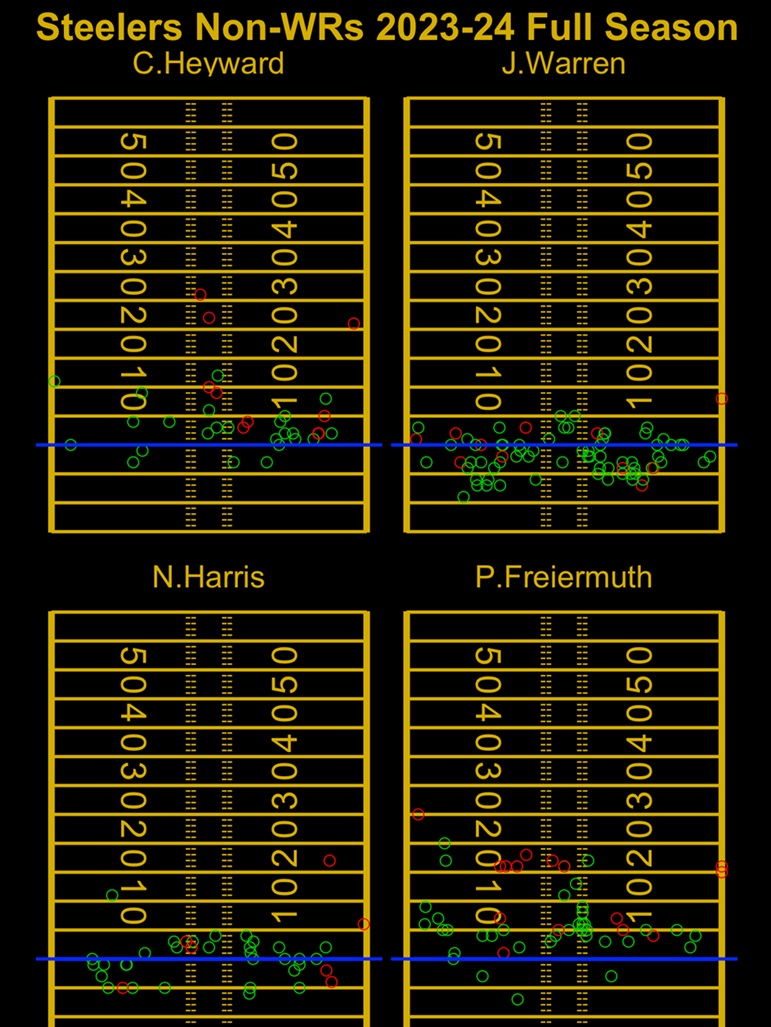
RB Jaylen Warren: Charted Targets: 75 (third). Catches: 64 (second). Catch Rate: 85.3 percent (first).
An even better catch rate in the last five games, previously at 82.7 percent, while being second on the team in catches and third in targets. One of the most consistent performers for Pittsburgh’s-offense in 2023.
TE Pat Freiermuth: Charted Targets: 52 (fourth). Catches: 37 (fourth). Catch Rate: 71.2-percent (third).
Improvements across the board are encouraging, with more opportunity following injury (missed five games). Improved his catch rate from 66.7 percent to 71.2, which moved up to third best (T-fifth previously).
TE Connor Heyward: Charted Targets: 34 (seventh). Catches: 24 (seventh). Catch Rate: 70.6-percent (T-fourth).
His targets cooled considerably in the final stretch after some encouraging play previously; he did have an uptick in catch rate from 67.7 percent.
RB Najee Harris: Charted Targets: 38 (sixth). Catches: 31 (sixth). Catch Rate: 81.6-percent (second).
His involvement in the pass game severely dropped upon Warren’s emergence, but Harris saw an uptick in his second-ranked catch rate as well, which was true for all four primary Steelers non-WRs.
Now heat maps for all charted targets and completion rates by pass distance:
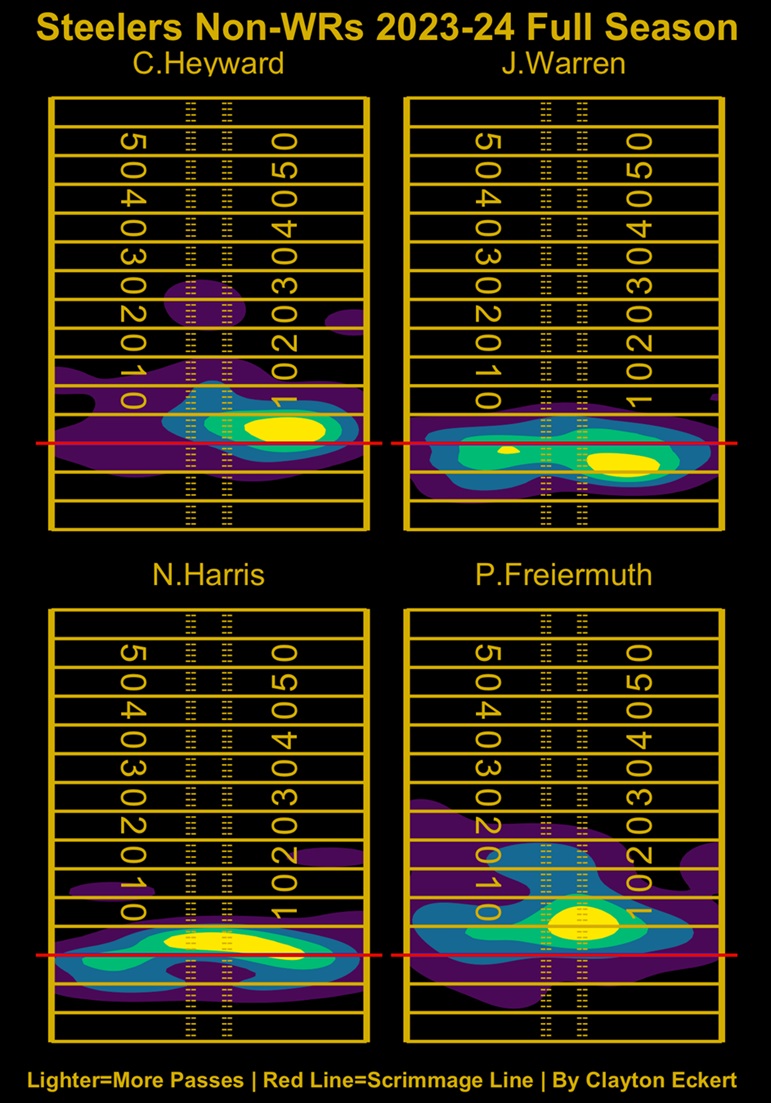
Warren — Behind the line: 40/45 (88.9 percent). 0-5 air-yards: 24/29 (82.8 percent). 5-10 air-yards: 2/3 (66.7 percent). 10-15 air-yards: 0/0. 15-20 air-yards: 0/0. Explosive: 0/0.
Warren’s longest catch was five air yards, highlighting the check down and efficient targets overall. Improved rates at five yards or less to end the year as well.
Freiermuth — Behind the line: 3/3 (100 percent). 0-5 air-yards: 20/24 (83.3 percent). 5-10 air-yards: 16/20 (80 percent). 10-15 air-yards: 2/3 (66.7 percent). 15-20 air-yards: 4/12 (33.3 percent). Explosive: 1/2 (50 percent).
He saw an uptick in several areas, aside from behind the line standing pat and his catch rate at 15-20 air yards. Low quantity of attempts at 10-15 and explosive air yards were discouraging. Hopefully that changes moving forward.
Heyward — Behind the line: 4/4 (100 percent). 0-5 air-yards: 15/20 (75 percent). 5-10 air-yards: 4/7 (57.1 percent). 10-15 air-yards: 2/3 (66.7 percent). 15-20 air-yards: 0/0. Explosive: 0/3 (0 percent).
Just three targets the final five games, all catches at less than five air yards.
Harris — Behind the line: 13/16 (81.3 percent). 0-5 air-yards: 17/19 (89.5 percent). 5-10 air-yards: 0/1 (0 percent). 10-15 air-yards: 1/1 (100 percent). 15-20 air-yards: 0/1 (0 percent). Explosive: 0/0.
Improved behind-the-line rate after three incompletions previously but 0-5 air yards dropped a bit from a stellar 92.3 percent through Week 14 and wasn’t targeted past five yards to close the year.
To close, here are non-RBs completions only heat map:
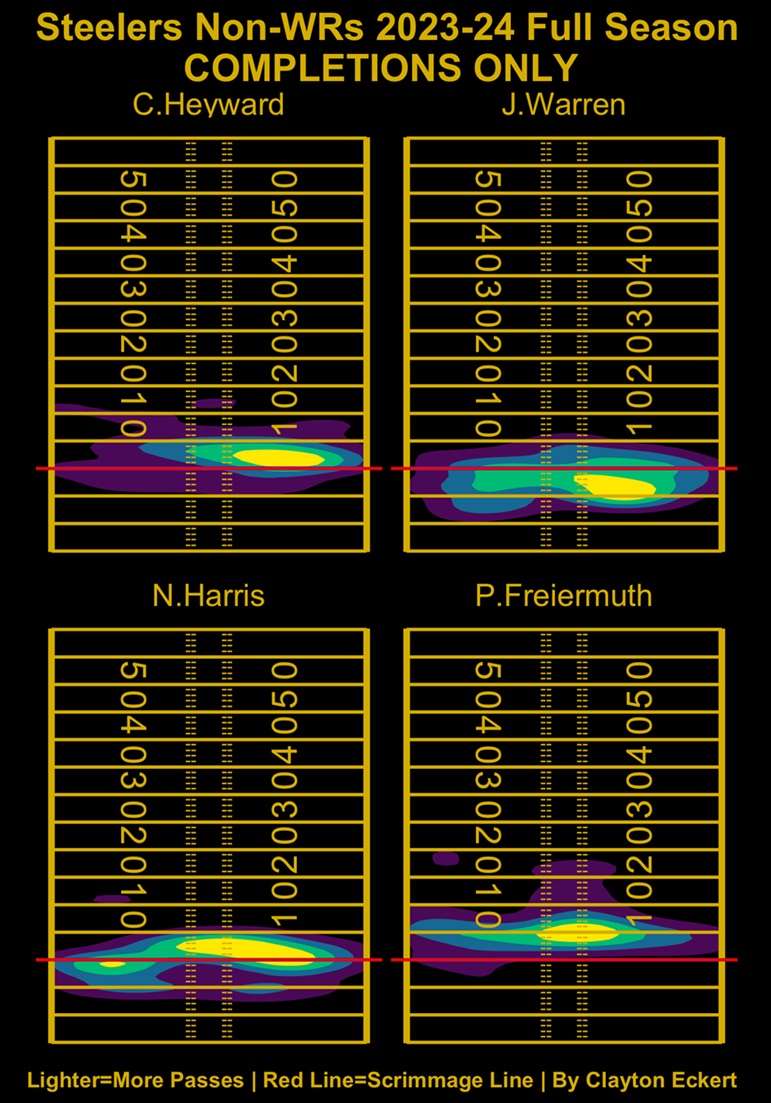
Wow. A severe lack of production from the group in terms of passing distance, which is expected at RB. TE usage, or lack thereof, was confusingly frustrating.
Freiermuth had just six catches past 10 yards, while Heyward only had two. Between the numbers at that distance were a struggle: Freiermuth (33.3 percent catch rate) and Heyward (25 percent catch rate). Only one explosive air yard completion to a TE all year, a 20-yarder to Freiermuth.
An improvement here would open a new challenge for opposing defenses. Here’s to hoping that’s an element the new offensive coordinator Arthur Smith brings to Pittsburgh.
Warren — Most targeted area: behind the line. Most completed area: behind the line from right hash to right numbers.
Freiermuth — Most targeted area: center to inside right numbers at 3-8 air yards. Most completed area: between the numbers at 3-7 air yards.
Heyward — Most targeted area: outside right hash to outside right numbers at 0-4 air yards. Most completed area: outside right hash to outside right numbers at 0-3 air yards.
Harris — Most targeted area: outside left hash to right numbers behind the line to 4 air yards. Most completed area: same, and outside left numbers behind the line.