Today I wanted to provide some valuable team metrics for the 2022 regular season. For the second season, I’ve used a cumulative format of key numbers across the NFL, along with takeaways for the Steelers season. The three main stats used are Adjusted Net Yards per Pass Attempt (ANY/A), Turnovers and Explosive Plays (TOX), Successful Run Rates. The total calculations are called CATS for short.
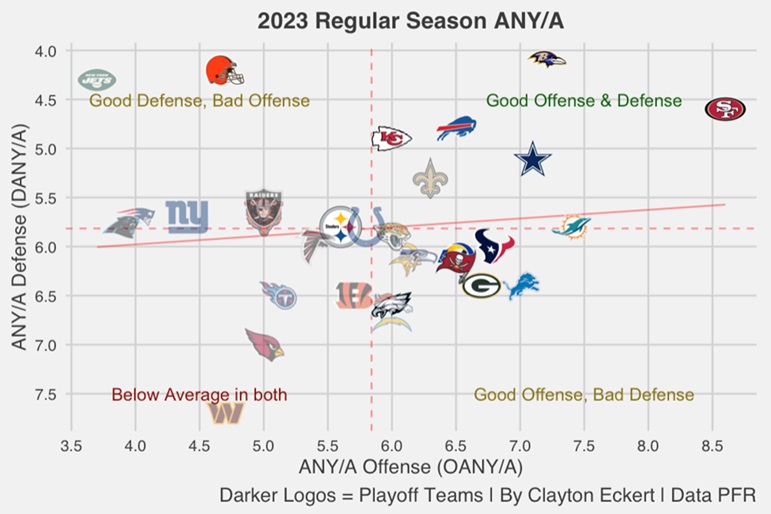
First, let’s look at ANY/A: (Passing Yards – Sack Yards + (20* Passing TD) – 45 * Interceptions)) / (Passes Attempted + Times Sacked). Using the differential for offenses (OANY/A) and defenses (DANY/A), this is the most predictive individual stat in predicting Super Bowl Winners that I have found in my studies:
Looking at the teams on the top right, we see five of the six teams comfortably made the playoffs (83.3-percent), with New Orleans being the only exception, and ironically was the case for them in 2022 as well. Speaking of which, there were a higher number of teams (nine) and playoff teams (eight, 88.9-percent) that had an above the mean ANY/A on both sides of the ball.
There has been a gravitation to the number on offense being more indicative to postseason privileges in today’s NFL, with 12 of 14 playoff teams above the league mean in OANY/A each of the last two seasons (85.7-percent). For comparison, there are six teams comfortably above average in DANY/A (42.9-percent), while two land virtually on the mean line.
One of the two teams is the Pittsburgh Steelers, with a 5.8 DANY/A that tied for 13th and posted a below average 5.6 OANY/A ranking 21st, for a -0.2 ANY/A differential that landed 18th league wide in 2023. I dove much deeper into the Steelers 2023 Regular Season ANY/A very recently if you’d like to check that out.
The visual also highlights no playoff team this season clearly below average in both. So, all 14 teams were at or above average in one or the other, with OANY/A particularly indicative to earning a playoff ticket. This largely leads to a positive ANY/A differential (OANY/A – DANY/A), with only one Super Bowl Champion since 2000 coming away with a Lombardi with a negative differential.
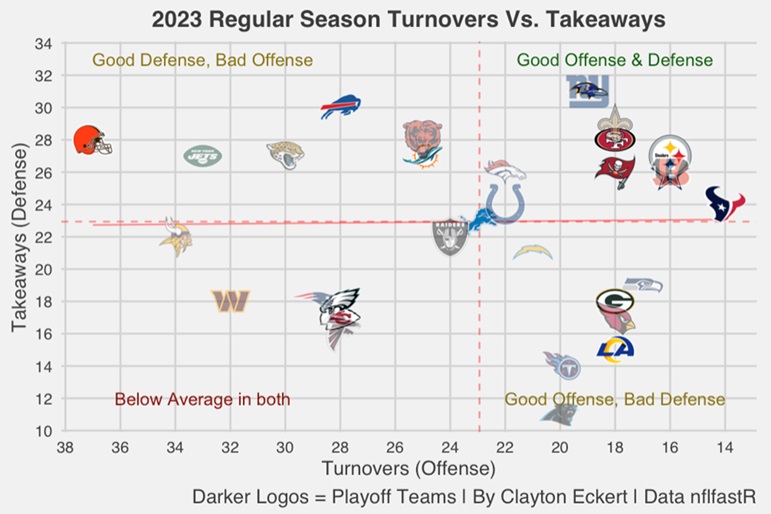
Next, let’s look at turnovers and takeaways around the 2023 NFL regular season:
Here we see one of Pittsburgh’s formulas for success. The Steelers are one of six postseason teams clearly above average in each (42.9-percent). Being above the mean in both doesn’t have any near correlation to making the playoffs as ANY/A.
Nine postseason teams were above league average this season at creating takeaways on defense (64.3-percent), including the Steelers with 27, tying for eight-best in the NFL. Eight playoff teams limited turnovers on offense (57.1-percent), with Pittsburgh’s 16 tying for second best league-wide. Here’s a deeper dive I did on turnover differentials through Week 15.
Interestingly we saw far more NFL teams clearly above the mean in both this season (11) than in 2022 (six), which also included the Steelers.
Two postseason teams (Eagles, Chiefs) were well below average in both, ironically dueling it out in Super Bowl last year, when Kansas City hoisted the Lombardi. They land very similarly on the 2023 chart, compared to both having better marks in 2022. Philadelphia was comfortably above the mean in each, while the Chiefs were below average in both, but much closer to the league mean.
So, while an important factor in outcomes of games, not a detriment to the ultimate goal of a Super Bowl, particularly if the team is strong in other areas. For example, the Chiefs sported the top ranks in OANY/A and explosive plays (20 yards or more) on offense in 2022.
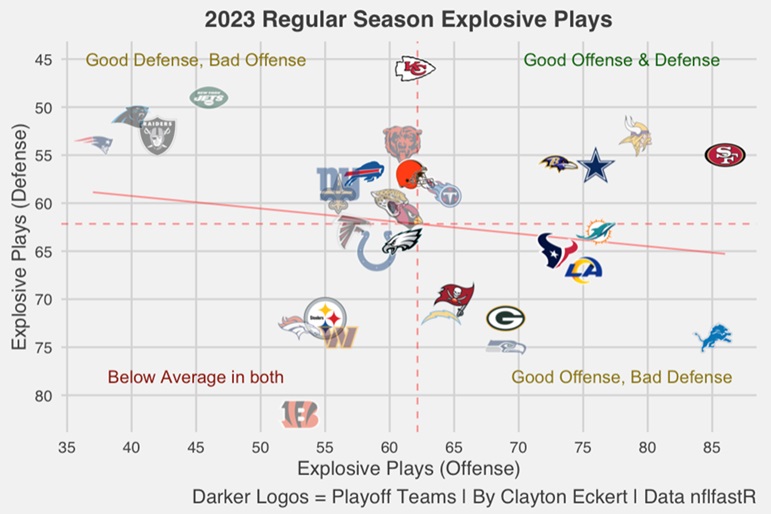
Speaking of which, let’s look at 2023 explosive play results on offense and defense:
Unfortunately, we see Pittsburgh has the worst explosive play result of playoff teams on both sides of the ball in 2023. 55 on offense ranked 26th, while 72 on defense tied for 25th. Definitely the biggest total issue for the Steelers this season of the data we’re looking at, which was also true in 2022. Not what you want to see.
Adding to that painful fact is seeing where other postseason teams land. Philadelphia is the only other playoff team below average in both, but land much closer to the league mean in each.
Nine postseason teams (64.3-percent) had above average explosive plays on offense, while just six were above the mean in limiting them (42.9-percent).
The reigning champion Chiefs have flipped the script in 2023, leading the NFL with the least explosive plays allowed on defense (46), compared to a big step back in offensive explosives to their aforementioned NFL best mark in 2022.
So, a high 12 playoff teams were above average on one side of the ball or another (85.7-percent), providing a stronger chance in making the postseason, rather than being above average in both, which only five NFL teams did this year and only three playoff-bound.
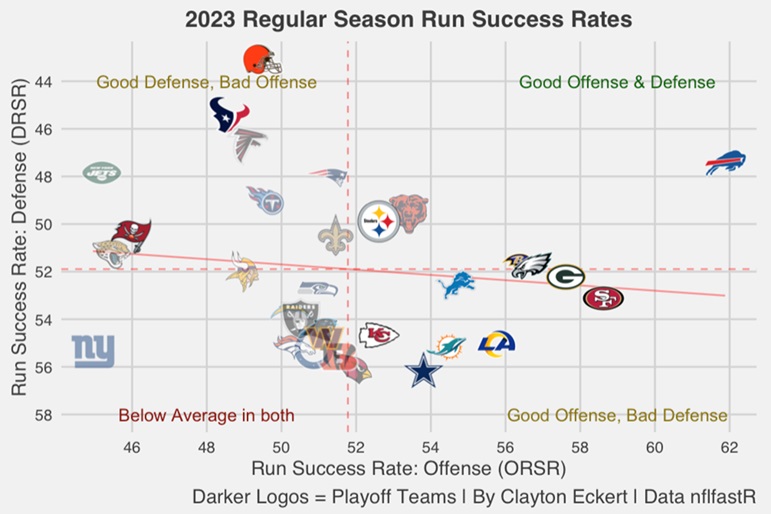
Here are the successful run rates, defined as six yards or 40-percent of the needed yardage on first down, six yards or 50-percent of the needed yardage on second down, and third or fourth downs gaining the needed yardage for a first down or a touchdown:
Back to good news in Steelers lenses, one of just three NFL teams clearly above the mean on both sides of the ball, with two of those three making the playoffs. Pittsburgh was also above the mean in both in 2022, so similar results-different season as we’ve seen largely in the article. This includes improvements in the run game, with the biggest differences thankfully in the win column and playoff privileges.
The other postseason team that was above average in both is Buffalo, Pittsburgh’s next and tough playoff challenge.
We see the Bills very comfortable above the league mean in each, particularly their 61.9 ORSR that is a dominant league best, while their 47.5 DRSR also ranks fourth in 2023. Being in the top five in each is rather impressive, as the best-balanced team in this regard, and will be tough to reckon with on Sunday.
In comparison, the Steelers 52.6 ORSR ranked 12th, along with a 49.9 DRSR that came in at ninth. Respectable as well, but we see Buffalo has the edge on paper, and exited to see the two squads duke it out with a heavy run game dosage, along with the high likelihood it’ll be a snow game.
No playoff team was below average on both sides of the ball. 11 of 14 postseason teams were above league mean on offense (78.6-percent), while only five comfortably above the mean on defense (35.7-percent).
So, the CATS formula held true overall compared to the 2022 season. Run success rates and turnovers had lower correlation to making the postseason, with explosive plays and the all-important ANY/A stat still reigning supreme as the best individual stat to predict playoff teams and Super Bowl winners.
Considering Pittsburgh’s strongest facets of their 2022 season were turnovers and run success rates and struggles in the ANY/A and explosive play elements of the game (particularly the latter), we get a clear picture with context around the league why they needed help from other teams to make the playoffs.
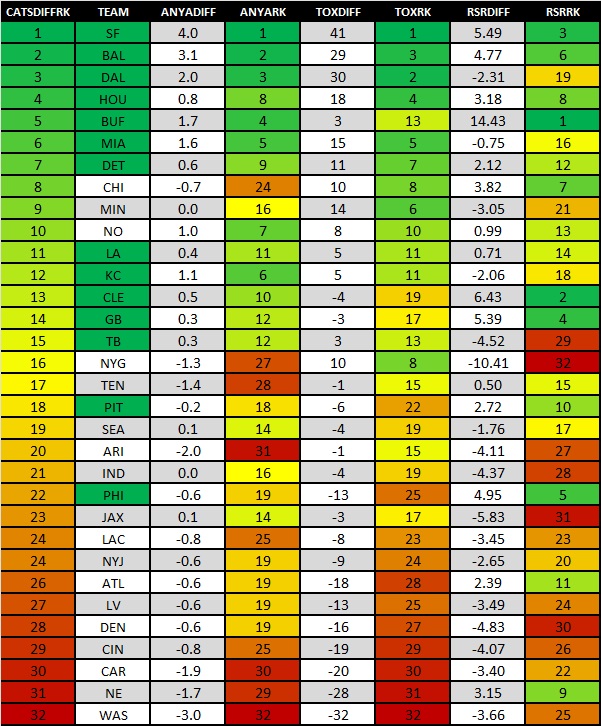
To close, here’s a table of the stats used today showing the differential numbers of team’s offenses and defenses along with their ranks, sorted by CATS differential, along with colored team names contending in the postseason:
Seven teams top the CATS differential ranks: 49ers, Ravens, Cowboys, Texans, Bills, Dolphins, and Lions. 12 of the top 15 CATS differentials made the postseason (80-percent), with Pittsburgh unfortunately on the outside looking in. They came in at 18th this season, with a tenth ranked RSR differential being the highlight, 18th in ANY/A differential, and 22nd in TOX.
Here’s to hoping Pittsburgh can continue that success on the ground against Buffalo, who hold the top rank in run success rate differential, fourth in ANY/A differential, and 13 in TOX. Last year’s Super Bowl participants were in the top three in CATS differential and can’t wait to see how the 2023-2024 postseason plays out.
Thanks for reading and let me know your thoughts in the comments.


