We’re back, tallying information about the 2023 Pittsburgh Steelers from the weekly charting we personally do. Stats and metrics we’ll be tracking throughout the rest of the season to compare it to past years and performances. If there’s anything you’re looking for not mentioned below, let us know in the comments and I’ll pull the data if we have it.
We’ll update this post before the final stretch of the season.
For clarity’s sake, this is out of 615 non “no play” (because of penalty) snaps on the year.
– Pittsburgh’s defense is on pace to log 1,161 snaps in 2023, averaging 68.33 snaps per game. It’s slightly better compared to the first five games when they averaged 70.5, but still a very high number that needs to come down. Here’s how the pace compares to other seasons.
2023: 615 snaps (68.3 per game)
2022: 1,012 snaps (59.5 per game)
2021: 1,108 snaps (65.2 per game)
2020: 992 snaps (62 per game)
2019: 1,067 snaps (66.7 per game)
2018: 1,021 snaps (63.8 per game)
2017: 979 snaps (61.2 per game)
2016: 1,040 snaps (65.0 per game)
2015: 1,102 snaps (68.9 per game)
Since our tracking dating back to 2015, the only year where Pittsburgh has averaged more snaps per game was 2015. Right now, the defense is on the field for about nine more snaps per game than they were in 2022.
– Here are the personnel groupings the team has used. We’ll talk big-picture first before breaking it down all the more.
Nickel: 37.4 percent (230 snaps)
3-4: 36.2 percent (223 snaps)
Dime: 20.8 percent (128 snaps)
4-4: 4.1 percent (25 snaps)
3-3-5: 0.5 percent (3 snaps)
Goal Line: 0.5 percent (3 snaps)
3-5: 0.3 percent (2 snaps)
2-5: 0.2 percent (1 snap)
– Through nine games, the Steelers’ base defense is still being used just about as often as any other. Some of that is the team being extra protective as the run defense has struggled, playing a fair amount of base against 11 personnel (12.2 percent, in part because they use hybrid 3-4 nickel packages with three CBs and one safety) along with just typical base against heavy personnel.
– More specifically, here’s every detailed grouping they’ve used.
Standard Nickel: 34.3 percent (211 snaps)
Standard 3-4: 29.6 percent (182 snaps)
Dime: 20.8 percent (128 snaps)
4-4: 4.1 percent (25 snaps)
3-4 Nickel: 3.1 percent (19 snaps)
Big Nickel: 3.1 percent (19 snaps)
3-4 Over: 2.3 percent (14 snaps)
3-4 Big: 1.1 percent (7 snaps)
3-3-5: 0.5 percent (3 snaps)
Goal Line: 0.5 percent (3 snaps)
3-5: 0.3 percent (2 snaps)
2-5: 0.2 percent (1 snap)
3-4 Over Nickel: 0.2 percent (1 snap)
– To define that a little bit, the 3-4 nickel includes three corners and one safety, big nickel includes three safeties and one corner, the over front is a d-line shift to the strength, the 3-4 big includes three safeties and one corner, while the 3-4 over nickel is a combination of the over front and three corners/one safety.
– Overall, here is the split between the base and sub-package (with goal line removed since it doesn’t fall into either neatly).
Sub-package: 59.0 percent (361 snaps)
Base: 41.0 percent (251 snaps)
– Last year, Pittsburgh had in sub-package at 68.2 percent. So we’re seeing a substantial decrease here.
– Through nine games, the Steelers’ blitz rate sits at 33.6 percent. That’s ticked up since our last charting. It’s up from 27.9 percent last year. Here are the weekly blitz numbers.
Week 1 vs. 49ers – 29.4 percent
Week 2 vs. Browns – 30.4 percent
Week 3 vs. Raiders – 17.8 percent
Week 4 vs. Texans – 28.6 percent
Week 5 vs. Ravens – 51.2 percent
Week 7 vs Rams – 48.5 percent
Week 8 vs Jaguars – 40.0 percent
Week 9 vs Titans – 33.3 percent
Week 10 vs Packers – 25.6 percent
Overall, an increase in the blitzing rate throughout the year. We’ll see how they handle Browns’ rookie Dorian Thompson-Robinson this weekend. They blitzed C.J. Stroud and Will Levis around the same, about 30 percent.
– The Steelers have rushed five or more defenders on 35.4 percent of dropbacks. That’s up a percent from the last time we looked at things after Week Five.
Defensive Line
Pressures
Keeanu Benton: 12
Larry Ogunjobi: 10
Armon Watts: 7
DeMarvin Leal: 6
Montravius Adams: 5
Cam Heyward: 2
Isaiahh Loudermilk: 1
– Benton has eight pressures over his last four games, the most by any defensive lineman for that span.
– Snaps per pressure. The lower the number, the better.
Keeanu Benton: 12.5
DeMarvin Leal: 16.6
Larry Ogunjobi: 24.4
Cam Heyward: 26.5
Montravius Adams: 34.4
Isaiahh Loudermilk: 49.0
– Benton’s number sat at 18.0 through five weeks and he was fourth of the unit. Now, he is the line’s top rusher. Really coming on strong. Some fading from Ogunjobi while Leal’s number looks better than his actual pass rush chops on tape.
– Yards per carry allowed when on the field. This isn’t an end-all number, it lacks context, but to offers a little window into their run defense production.
Cam Heyward: 2.8 YPC
Isaiahh Loudermilk: 3.6 YPC
Armon Watts: 3.7 YPC
Keeanu Benton: 3.9 YPC
Larry Ogunjobi: 4.5 YPC
Montravius Adams: 4.7 YPC
DeMarvin Leal: 5.8 YPC
– Heyward’s return is certainly welcomed.
Linebackers
Pressures
T.J. Watt: 42
Alex Highsmith: 33
Markus Golden: 5
Cole Holcomb: 4
Nick Herbig: 3
Elandon Roberts: 3
Snaps Per Pressure
T.J. Watt: 7.2
Alex Highsmith: 8.5
Markus Golden: 8.8
Nick Herbig: 9.0
Herbig has come on well with three pressures over his last ten rush attempts. Strange he played so little against Green Bay (two snaps). Overall, to have the entire OLB group under ten is remarkable.
Drop/coverage rate of the four outside linebackers
T.J. Watt: 7.6 percent
Alex Highsmith: 11.4 percent
Nick Herbig: 18.2 percent
Markus Golden: 18.5 percent
Herbig and Golden have had their coverage percentages come down while Watt and Highsmith have stayed just about the same.
Target Numbers
Cole Holcomb: 5/10 70 yards 0 TDs 0 INTs
Elandon Roberts: 9/10 102 yards 0 TDs 0 INTs
Kwon Alexander: 5/13 15 yards 0 TDs 1 INT
QB Rating Against
Kwon Alexander: 14.6
Cole Holcomb: 72.9
Elandon Roberts: 109.2
Defensive Backs
Target Numbers
Darius Rush: 0/1 0 yards 0 TDs 0 INTs
Miles Killebrew: 1/1 29 yards 0 TDs 0 INTs
Elijah Riley: 1/2 36 yards 0 TDs 0 INTs
Chandon Sullivan: 9/13 102 yards 1 TD 0 INTs
Damontae Kazee: 8/17 208 yards 1 TD 2 INTs
Minkah Fitzpatrick: 10/18 123 yards 0 TDs 0 INTs
Keanu Neal: 10/20 142 yards 1 TD 0 INTs
Joey Porter Jr.: 7/23 65 yards 0 TDs 1 INT
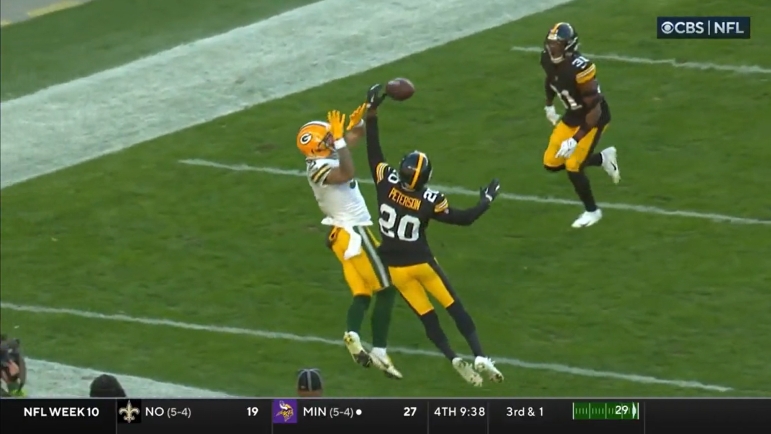
Patrick Peterson: 22/37 341 yards 4 TDs 2 INTs
Levi Wallace: 28/48 400 yards 4 TDs 2 INTs
– If you’re wondering why Peterson has two interceptions and Neal none, it’s because of the way I always chart these. These are targets, not always outcomes. Because Peterson was the CB targeted against the Green Bay Packers and made the play on the ball, batting it to Neal, he gets credit for the INT instead of Neal. Because Peterson was the target and made the play.
QB Rating Against
Joey Porter Jr. 21.8
Darius Rush: 39.6
Damontae Kazee: 72.3
Minkah Fitzpatrick: 76.9
Keanu Neal: 90.0
Elijah Riley: 95.8
Levi Wallace: 95.8
Patrick Peterson: 103.6
Chandon Sullivan: 118.1
Miles Killebrew: 118.8
– Numbers aren’t as strong overall as you’d like, though Porter’s is excellent. Some small sample size issues with several of these names, too.
– Sullivan leads all Steelers DBs with 21 blitzes. He has three pressures. Peterson has six blitzes with two pressures.