Today I wanted to provide the other side of the coin to my weekly Steelers’ Quarterback Passing Locations articles, looking at and providing takeaways for Pittsburgh’s receivers at the bye week.
A couple of notes before we jump in. Thanks to Thomas Mock for his great work that helped me learn much of what I’m using in the series visually. Spikes and clear throwaways are removed due to being the correct situational decision, along with batted passes at the line of scrimmage that affect the intended pass location.
First, let’s look at the wide receivers’ dots, starting with targets (minimum of five), catches, and catch rates along with team ranks (eight qualifiers):
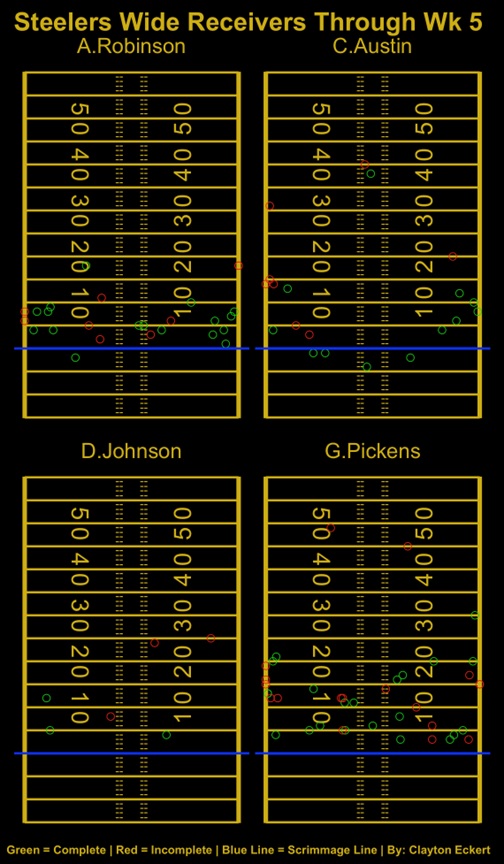
George Pickens-Charted Targets: 40 (first). Catches: 22 (first). Catch Rate: 55-percent (seventh).
Just two targets on or between the hashes (50 percent), one a third and two conversion and a pass breakup in the end zone. His route tree has encouragingly varied in year two, and sans Diontae Johnson, but only 15 targets between the numbers and eight catches (53.3 percent). This included a 71-yard triple-explosive touchdown with great YAC and interception that came in week two on slant routes. 14/25 on or outside the numbers (56-catch rate, 62.5 percent of targets). Several back-shoulders last week (Steelers now rank second as a team with seven per SIS) and the go-ball touchdown.
Allen Robinson II-Charted Targets: 26 (second). Catches: 17 (third). Catch Rate: 65.4 percent (second).
Robinson has filled the “possession receiver” role very well, working the short area of the field, with 84.6 percent of his targets at 10 air yards or less. Most of his success has been on out-and-stop routes, particularly 13/17 outside the numbers (76.5-catch rate, 65.4-percent of targets). Very sure-handed in these terms, with all four incompletions thrown out of bounds. Struggles have come in between the numbers, 3/8 for a 37.5 completion rate, though he is 2/2 on or between the hashes.
Calvin Austin III-Charted Targets: 20 (fourth). Catches: 12 (fourth). Catch Rate: 60.0 percent (fifth).
Austin was thrust into a larger role than anticipated, with 73.6% of his pass snaps out wide per PFF. The chart tells a clear story: behind the line, outside the numbers, or deep shot. Albeit a low bar, he has the most on or between the hash targets (three) including two explosives, one with YAC for the 72-yard triple-explosive touchdown, then the same play intercepted the following game. 7/14 outside the numbers (50 percent), and six of the seven incompletions to the left.
Diontae Johnson-Charted Targets: 6 (last). Catches: 3 (last). Catch Rate: 50.0 percent (last).
Playing in just the season opener, no major proclamations of course. 0/2 on explosives including an interception though, a bad throw/decision from Pickett with Johnson also slipping on the play. Can’t wait for his return to the passing offense, shifting the rest of the room back to their intended roles and hopefully improving play.
Here’s a heat map of all targets, then completion rates by pass distance:
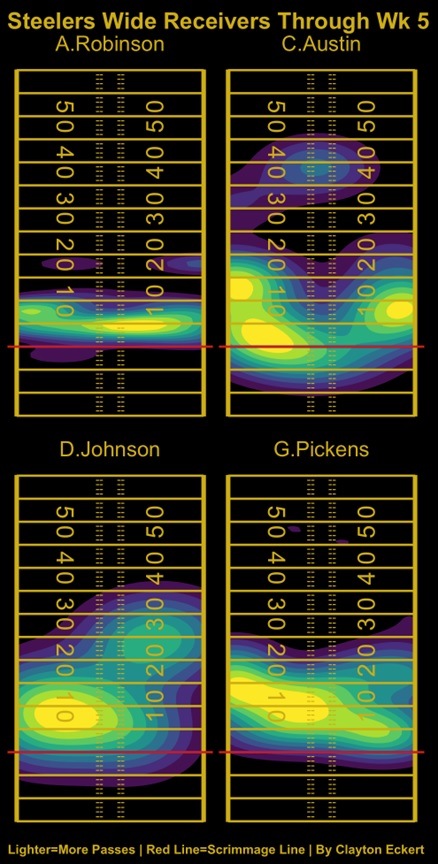
Pickens-Behind the line: 0/0. 0-5 air-yards: 7/10 (70 percent). 5-10 air-yards: 6/9 (66.7 percent). 10-15 air-yards: 5/14 (35.7 percent). 15-20 air-yards: 5/10 (50 percent). Explosive: 5/7 (71.4 percent).
10-15 air yards has been the most frequent, and the lowest catch rate by far. If he and QB Kenny Pickett connect more in this area of the field, it could do wonders for the passing offense. Impressively, Pickens highest catch rate is explosives, which hopefully continues.
Robinson-Behind the line: 1/1 (100 percent). 0-5 air yards: 8/11 (72.7 percent). 5-10 air yards: 9/13 (69.2 percent). 10-15 air-yards: 1/2 (50 percent). 15-20 air yards: 1/3 (33.3 percent). Explosive: 0/0.
Most frequent has been 5-10 air yards, with his catch rates decreasing further away from the line of scrimmage, and no explosive targets to date.
Austin- Behind the line: 4/4 (100 percent). 0-5 air yards: 2/4 (50 percent). 5-10 air yards: 3/4 (75 percent). 10-15 air yards: 3/6 (50 percent). 15-20 air yards: 0/2 (0 percent). Explosive: 1/4 (25 percent).
Lower volume and catch rate than I expected at 0-5 air yards. Most successful has been behind the line and 5-10 air yards, with four targets at each distance (87.5-catch rate). Most frequent is 10-15 air yards, where intermediate-explosive rates declined sans his touchdown.
Johnson-Behind the line: 0/0. 0-5 air yards: 2/2 (100 percent). 5-10 air yards: 1/2 (50 percent). 10-15 air yards: 1/1 (100 percent). 15-20 air yards: 0/0. Explosive: 0/2 (0 percent).
Here are the completions-only heat map:
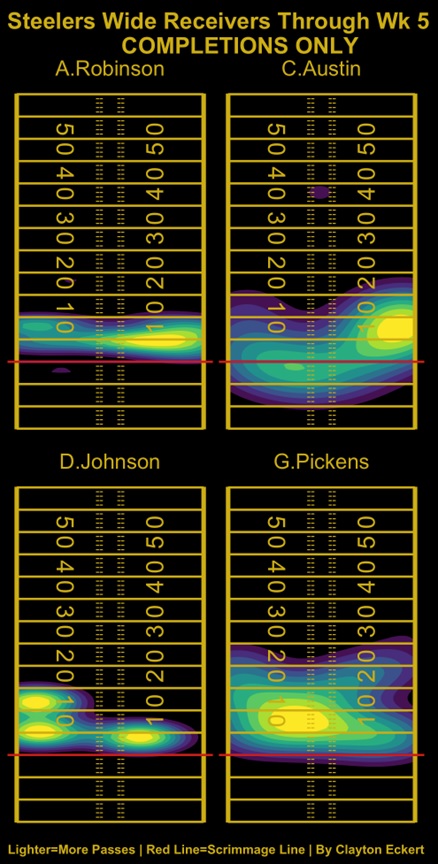
Pickens has the high explosive catch rate, but the last visual emphasizes the two longest targets (45 and 49) were incomplete. Austin had the third double-explosive air-yard target, the aforementioned interception, so 0/3 on those attempts.
Pickens-Most targeted area: middle-left sideline at seven-16 air-yards. Most completed area: middle-left numbers at five-11 air yards.
Robinson-Most targeted area: middle-right numbers at three-six air-yards. Most completed area: outside right hash-outside right numbers at three-six air yards.
Austin-Most targeted area: outside left hash-outside left numbers at -2-six air-yards, left sideline at 10-15 air-yards, and right sideline at six-ten air-yards. Most completed area: outside right numbers-right sideline at four-11 air yards.
Johnson-Most targeted area: left hash-outside left numbers at four-12 air yards. Most completed area: outside left numbers at four-seven and 10-12, and in between right hash/numbers at three-five air yards.
Now for the non-WRs, starting with their dots:
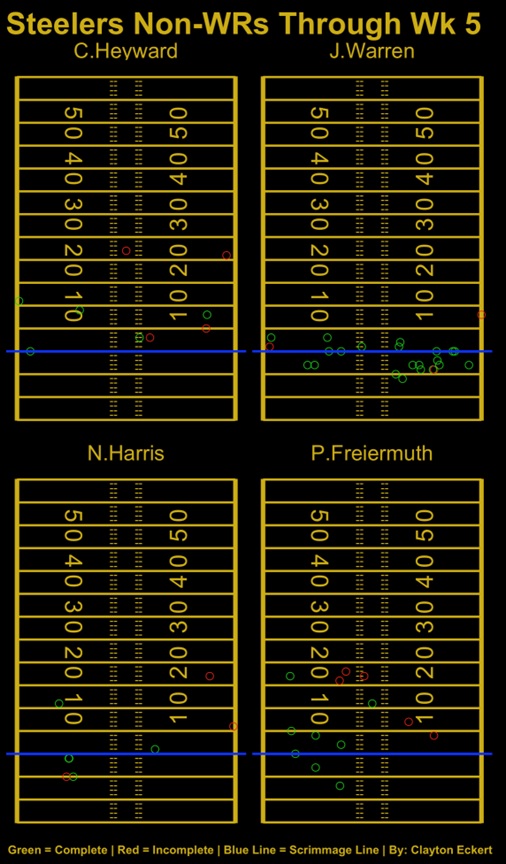
RB Jaylen Warren: Charted Targets: 24 (third). Catches: 21 (second). Catch Rate: 87.5 percent (first).
Warren’s role has encouragingly increased this season, with impressive volume (second on the team) and catch rates, but one drop on the season. He has been a great check down option, with all but one target at three air yards or less, particularly to the right. Warren has -24 total completed air yards, providing 166 receiving yards (fourth in NFL), along with a league-leading 13 forced missed tackles and 204 in YAC among RBs.
TE Pat Freiermuth: Charted Targets: 13 (fifth). Catches: eight (fifth). Catch Rate: 61.5 percent (fourth).
Though he missed the last game due to injury, it’s been a disappointingly quiet year, especially with Johnson sidelined. The struggle has been in between the numbers at five-plus air yards (1/5, 20 percent), and 1/2 on/between the hashes. 7/8 to the left, with the majority at five air yards or less, including his two red zone touchdowns at three and 13 air yards.
TE Connor Heyward: Charted Targets: nine (sixth). Catches: five (T-sixth). Catch Rate: 55.6 percent (sixth).
Heyward has made some good plays/catches this season. He is the only non-WR with explosive targets, but 0/2 on these attempts including an interception in week one. 1/2 on/between the hashes. Less connection to the right (1/4) compared to 3/3 on the left.
RB Najee Harris: Charted Targets: eight (seventh). Catches: five (T-sixth). Catch Rate: 62.5-percent (third).
Much less volume than expected from Harris going into 2023. More success to the left (3/4) than the right (1/3). His chart has more depth than Warren, thanks to a couple of scramble drills. One was a fantastic throw and catch with YAC, but a flip-side play was a poor decision/dropped interception.
Now the all targets heat map and completion rates by pass distance:

Warren-Behind the line: 11/12 (91.7 percent). 0-5 air yards: 10/11 (90.9 percent). 5-10 air yards: 0/1 (0 percent). 10-15 air yards: 0/0. 15-20 air yards: 0/0. Explosive: 0/0.
Behind the line has been most frequent, with 0-5 air-yards a close second, and strong catch rates of 90-plus at each distance. Only one target outside of that, an eight-yard incompletion.
Freiermuth-Behind the line: 2/2 (100-percent). 0-5 air yards: 4/5 (80-percent). 5-10 air yards: 1/2 (50-percent). 10-15 air yards: 1/1 (100-percent). 15-20 air yards: 1/4 (25-percent). Explosive: 0/0.
Most successful has been behind the line and 10-15 air yards, but only one target at the latter. Most frequent is 0-5 yards, which has also gone well overall. Outside of his 17-yard touchdown, three incompletions at 15-plus air yards, and no explosive air-yard targets is on my radar for hopeful changes.
Heyward-Behind the line: 0/0. 0-5 air yards: 2/4 (50-percent). 5-10 air yards: 2/3 (66.7 percent). 10-15 air yards: 1/1 (100-percent). 15-20 air yards: 0/0. Explosive: 0/2 (0-percent).
The majority of Heyward’s targets have been 0-10 air yards (77.8 percent) which has been hit or miss. Just one catch in the intermediate range, on top of the previously mentioned explosive misses with an interception.
Harris-Behind the line: 3/4 (75-percent). 0-5 air yards: 1/1 (100-percent). 5-10 air yards: 0/1 (0 percent). 10-15 air yards: 1/1 (100-percent). 15-20 air yards: 0/1 (0 percent). Explosive: 0/0.
Like Warren, behind the line was most frequent, and no explosive targets. Only one target at the other four pass distances, emphasizing his lack of involvement once again.
To close, here is the non-RBs completions only heat map:
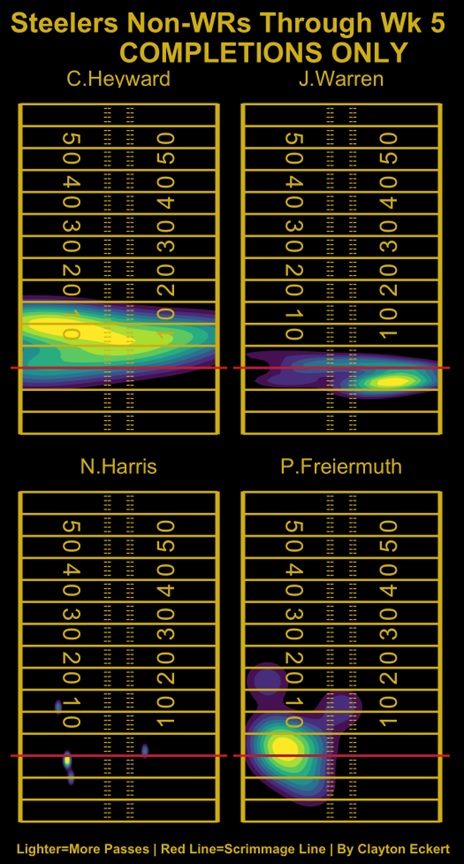
Did I mention the volume for Harris? Just five catches in as many games. Warren is doing great, but wants more. Heyward has the only two explosive air-yard targets, which I hope Freiermuth provides soon and through the season.
Warren-Most targeted area: near right numbers at -2 to -4 air yards. Most completed area: same.
Freiermuth-Most targeted area: near left numbers at -2-four air yards. Most completed area: same.
Heyward-Most targeted area: right hash-right numbers at two-seven air- ards. Most completed area: right hash-left sideline at five-11 air yards.
Harris-Most targeted area: near left numbers at -five to 0 air-yards. Most completed area: left numbers at -2 to zero air yards.
Thanks for reading and let me know your thoughts in the comments.