Continuing with the series, I wanted to look at and provide more context with situational football for the position in the 2020 season using Sports Info Solutions (SIS). Similar to the last study I’m focusing on players selected in the 2022 NFL draft, and a few players were excluded due to SIS not tracking smaller school players. This time around I’ll key in on players with larger sample sizes as well. The goal for today is to see how new Pittsburgh Steelers wide receivers George Pickens and Calvin Austin III stacked up to their peers in the 2020 season.
First, let’s look at opportunity with the number of routes run and targets in the red zone:
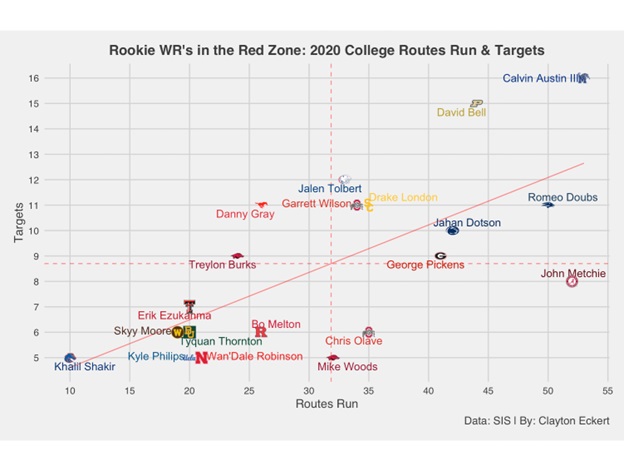
Right away we see Austin III topping the results with the most targets and routes run of the 20 players on the graph. This is an encouraging start compared to the data for last season when he had less opportunity, though it is important to note five players had more than 60 routes run along with six players with more targets last season for additional context to Austin III top results in 2020. Pickens ranks sixth in routes run and just above the mean with nine targets.
Now let’s dive deeper with for more context on these opportunities with completion percentage and on target catch percentage (total receptions/number of catchable targets) which highlights the quality of targets and connectivity:
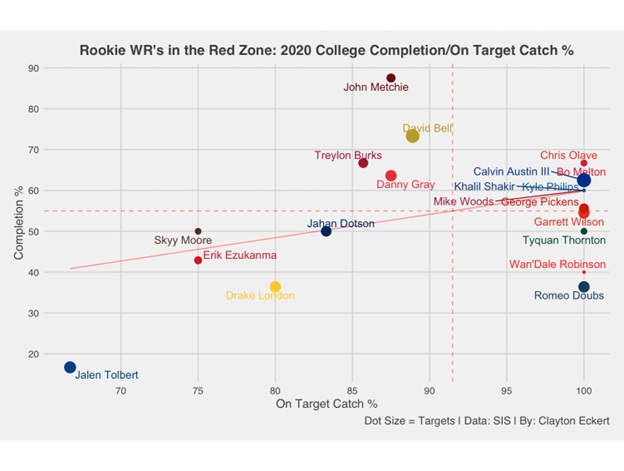
The players on the far right made the most of their situations, and the wide receivers on the bottom right gain positive context of their low overall completion percentages with their 100% on target catch results.
Seven players land on the top right including Austin III and Pickens, with each having a perfect on target catch percentage and the former having the stronger overall completion percentage of the two. Encouraging results for both men, cashing in on catchable targets in money situations, and also considering Austin III’s low results last season that would have landed him just above South Alabama’s Jalen Tolbert (Cowboys) on this graph.
Next, I wanted to gain context on targets short of the goal line, and who created yards after catch along with yards after contact with their percentages charted below:

Boise State’s Khalil Shakir (Bills) tops the graph, along with a high yards after catch percentage above 90 from SMU’s Danny Gray (49ers). The players on the bottom left were targeted more often in the end zone largely speaking, contributing to their YAC results.
Austin III lands above the mean in yards after contact percentage, with two of his eight red zone touchdowns coming in these situations. While Pickens was below the mean in both stats, it is one of the few times you will see him top Austin III in a YAC stat in this shortened area of the field. Pickens provided three red zone touchdowns in his opportunities, with two of them having YAC attached to them.
Let’s continue to gain context on this data with the most important factors, the players touchdown percentages in these money situations along with crucial mistakes with drop percentages along with some takeaways from their tape:
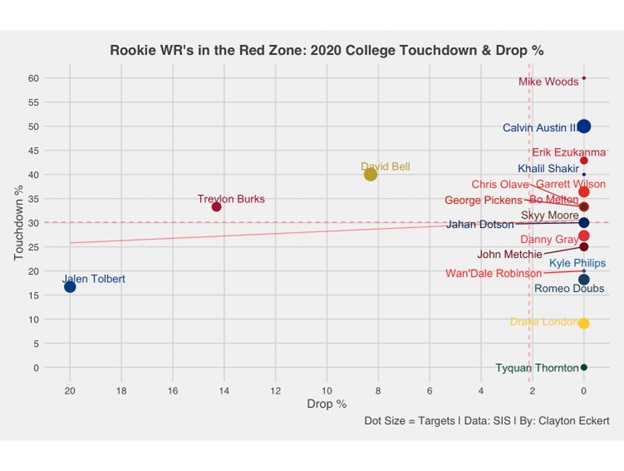
More encouraging context here, with both Steelers draft picks above the mean in each data point. Austin III had no drops and the second highest touchdown percentage at 50%, very impressive considering his highest usage. I was able to locate some of his red zone touchdowns in 2020, and was particularly encouraged with his two touchdowns against UCF. One was on a quick slant early in the game creating separation and running it in for the score and the latter an out route off motion behind the slot receiver creating space in the end zone, icing an impressive late comeback with 1:12 left in the fourth quarter on third and goal for the win.
Pickens also provided good red zone value with no drops and an above the mean touchdown percentage above 30. He had a red zone touchdown on a nice slant route creating separation from the slot position in the bowl game against Cincinnati, but in the same game he let up on his route on an off target pass in the end zone resulting in an interception. Against Mississippi State, Pickens made an impressive contested catch on a comeback route in the end zone. His third red zone touchdown in 2020 was also on a comeback route against Arkansas, creating good separation short of the goal line and great awareness with his back to the defender to cut outside for YAC on the diving score.
To close I wanted to provide a total value view using points earned per route (The total of a player’s EPA responsibility on routes run using the total points system that distributes credit among all players on the field for a given play. Totals are scaled up to map to the average points scored or allowed on a team level, with the player’s snap count determining how much to adjust. For receivers, this includes accounting for offensive line play, off-target passes, dropped passes, and broken tackles. Values are modulated using a quality-of-competition multiplier based on each opponent’s previous year of performance) and EPA per target (the total change in the offense’s expected points that came on passes thrown to the player):
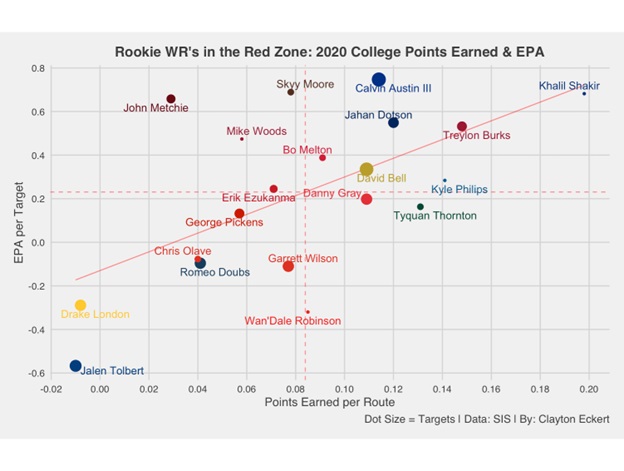
Austin III ranks first in EPA per target and is one of seven players to land above the mean in both data points with quality red zone play. The other players with particularly strong results include: Boise State’s Khalil Skakir (Bills), Penn State’s Jahan Dotson (Redskins), Arkansas’ Treylon Burks (Titans), and UCLA’s Kyle Philips (Titans) with their dot sizes highlighting the quantity.
Pickens lands below the mean in each data point, with his stronger result of the two in EPA per target. The touchdown plays I highlighted are encouraging, showing separation, awareness, and contested catch abilities. Regarding the stats, he had strong/above average results in routes run, targets, completion and on target catch percentages, touchdown percentage and drop percentage. His below average/lower results were yards after catch and contact, points earned per route, and EPA per target. Austin III had strong results overall including routes run, targets, completion and on target percentages, yards after contact percentage, touchdown percentage, drop percentage, points earned per route and EPA per target. His only below the mean result in today’s study was yards after catch.
Austin III’s results the past two seasons were quite different, with discouraging stats last season and lots of encouraging context in 2020 as I’ve highlighted today. While many factors can contribute to this, it is important to note the different quarterbacks playing for Memphis each season. While Austin III had more total receptions last season from quarterback Seth Hennigan, 2020 Memphis quarterback Brady White targeted Austin III much more in the red zone and had a much higher red zone touchdown rate overall, important context considering both quarterbacks had the same amount of red zone opportunities via cfbstats. Austin III’s routes in 2020 seemed to play to his strengths with better success on more cutting and separation opportunities, compared to less success last season when he was targeted more on the boundary where his lack of size could be swallowed up by defenders.
It will be interesting to see what Pickens and Austin III’s opportunities as Steelers rookies look like in this regard, if either can provide red zone value in their rookie season, and if so what their level of success is with the new faces competing for the starting quarterback job.
Throughout the rest of the offseason, I will dive deeper into the data as we continue to learn about the newest Pittsburgh Steelers. How do you think George Pickens and Calvin Austin III will fare in his rookie year? Do you think either will be a factor in the red zone? What are some of your takeaways across the league? Thanks for reading and let me know your thoughts in the comments!