In anticipation to the Super Bowl on Sunday I wanted to look at a historical view of the Adjusted Net Yards Per Pass Attempt (ANY/A) stat which is (Passing yards – Sack Yards + (20 * Passing TD) – (45 * Interceptions)) / (Passes Attempted + Times Sacked) for offenses and defenses, this time looking at the data for Super Bowl Winners since 2000:
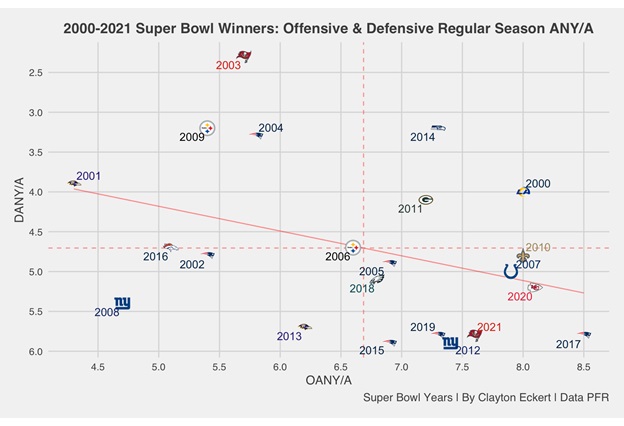
Here we can see how each NFL champion fared in the year they won the Super Bowl. The best defense in the time period were the 2003 Buccaneers, with an outstanding 2.3 DANY/A and a third ranked differential of 3.4! This great defense had 43 sacks and an impressive 31 interceptions and included great players (but was not limited to) defensive lineman Warren Sapp and Simeon Rice (15.5 sacks), linebacker Derrick Brooks, cornerbacks Ronde Barber and Brian Kelly (eight interceptions), and last but not least safety John Lynch along with Mike Tomlin as a defensive backs coach as well!
The Pittsburgh Steelers 2009 championship defense tied for second best with a great 3.2 DANY/A number and can’t leave any starter out of this stacked group: defensive lineman Aaron Smith, Casey Hampton, and Brett Keisel, linebackers LaMarr Woodley (11.5 sacks), James Farrior, Larry Foote, and James Harrison (16 sacks), cornerbacks Ike Taylor and Bryant McFadden, and safeties Ryan Clark and Troy Polamalu with seven interceptions! This group had 20 interceptions along with an impressive 51 sacks!
The 2014 Seahawks “Legion of Boom” defense were the group that interestingly matched Pittsburgh’s 2009 mark, with great players including linebackers Bruce Irvin, Bobby Wagner, and K.J. Wright and secondary including Richard Sherman (eight interceptions), Earl Thomas, and Kam Chancellor! They also had the best ANY/A differential in the time period of 4.1, leaning more heavily on the running game on offense with running back Marshawn Lynch and quarterback Russell Wilson to pair with their stellar defense that had 44 sacks and 28 interceptions!
There are many other good defenses, with seven landing well above the mean, who were some of your favorites?
We can also see the 2006 Steelers landed closest to the mean on the graph, winning the Wildcard round against the Bengals in route to a young Ben Roethlisberger’s first Super Bowl win! The offense had a higher ANY/A number than the 2009 team, with the top six receivers all having a yards per reception average above ten: wide receivers Hines Ward, Antwaan Randle El, and Cedrick Wilson, tight end Heath Miller, along with running backs Willie Parker and Verron Haynes.
The best offense in the time period were the 2017 Patriots with a great 8.5 OANY/A number. They were of course led by quarterback Tom Brady and impressively four players with 500 receiving and a yards per reception average above ten: wide receivers Julian Edelman and Chris Hogan along with tight ends Martellus Bennett and Rob Gronkowski with the latter an outstanding 21.6 yards per reception!
Quarterback Patrick Mahomes and the 2020 Chiefs offense had the second highest number of 8.1, also having four players with 500 receiving yards and a yards per reception number above ten: tight end Travis Kelce along with wide receivers Tyreek Hill, Sammy Watkins, and Mecole Hardman who topped the team with a great 20.7 yards per reception!
There was a tie for the third best OANY/A result between the 2000 Rams and the 2010 Saints at 8.0, falling just behind the 2020 Chiefs by a decimal point!
The first were 2000 Rams “greatest show on turf” offense led by quarterback Kurt Warner and also had four players with a yards per reception number above ten and over 500 receiving yards, two of which had over 1000: wide receiver Isaac Bruce and impressively running back Marshall Faulk (who also had 1381 rushing yards) along with wide receivers Torry Holt and Az-Zahir Hakim. They also have the second ranked differential of four, with a defense highlighted by lineman Kevin Carter (17 sacks) and safety Todd Light (six interceptions) with team totals of 29 interceptions and a whopping 57 sacks!
The 2010 Saints and quarterback Drew Brees round out the top three in the offensive data point, and like the other top OANY/A teams, had four players with 500 receiving yards and a yards per reception number above ten: wide receivers Marques Colston, Devery Henderson, Robert Meachem, and tight end Jeremy Shockey. They also had the fourth ranked differential of 3.2, but the lowest DANY/A of the top five differential teams, leaning more on their offense.
There are many other good offenses, with a high number of 13 above the mean, who were some of your favorites?
The 2011 Packers were the third team to make the top right quadrant on the graph along with the 2014 Seahawks and 2000 Rams, with a top five differential of 3.1. This Green Bay team defeated the Steelers, Pittsburgh’s third and final Super Bowl appearance in the time period. Led by Aaron Rodgers, the receiving corps also met criteria of the top three offenses with wide receivers Greg Jennings, James Jones, Jordy Nelson, and Donald Driver along with a defense highlighted by linebackers Clay Matthews (13.5 sacks) and A.J. Hawk, defensive lineman Cullen Jenkins and B.J. Raji, and a secondary including Charles Woodson, Tramon Williams (six interceptions), and Nick Collins. As a team they tallied 24 interceptions and 47 sacks.
Here is a table view of the data, ranking the teams by ANY/A differential:
| RANK | SB YEAR | TEAM | OANY/A | DANY/A | DIFF |
|---|---|---|---|---|---|
| 1 | 2014 | SEA | 7.3 | 3.2 | 4.1 |
| 2 | 2000 | STL | 8.0 | 4.0 | 4.0 |
| 3 | 2003 | TB | 5.7 | 2.3 | 3.4 |
| 4 | 2010 | NO | 8.0 | 4.8 | 3.2 |
| 5 | 2011 | GB | 7.2 | 4.1 | 3.1 |
| 6 | 2020 | KC | 8.1 | 5.2 | 2.9 |
| 6 | 2007 | IND | 7.9 | 5.0 | 2.9 |
| 8 | 2017 | NE | 8.5 | 5.8 | 2.7 |
| 9 | 2004 | NE | 5.8 | 3.3 | 2.5 |
| 10 | 2009 | PIT | 5.4 | 3.2 | 2.2 |
| 11 | 2005 | NE | 6.9 | 4.9 | 2.0 |
| 12 | 2006 | PIT | 6.6 | 4.7 | 1.9 |
| 13 | 2021 | TB | 7.6 | 5.8 | 1.8 |
| 14 | 2018 | PHI | 6.8 | 5.1 | 1.7 |
| 15 | 2019 | NE | 7.3 | 5.8 | 1.5 |
| 15 | 2012 | NYG | 7.4 | 5.9 | 1.5 |
| 17 | 2015 | NE | 6.9 | 5.9 | 1.0 |
| 18 | 2002 | NE | 5.4 | 4.8 | 0.6 |
| 19 | 2013 | BAL | 6.2 | 5.7 | 0.5 |
| 20 | 2016 | DEN | 5.1 | 4.7 | 0.4 |
| 20 | 2001 | BAL | 4.3 | 3.9 | 0.4 |
| 22 | 2008 | NYG | 4.7 | 5.4 | -0.7 |
After diving into the historical data deeper, a correction to the framework is needed. No team had a DANY/A of six or above (previously stated 6.1), and only one team had a negative differential (the 2008 Giants). Nonetheless, the data is still a great predictive measure to who will ultimately win the Super Bowl.
This Sunday we will see the Los Angeles Rams and the Cincinnati Bengals duel for the title, and if the above data holds true, the 2022 Super Bowl Champion will be the Rams considering they meet the framework (7.3 OANY/A, 5.3 DANY/A, 2 DIFF) which would tie for 11th historically in differential, and the Bengals (7.4 OANY/A, 1.2 DIFF) but missing the framework with a DANY/A number at 6.2.
What are some of your favorite takeaways? Who is your pick to win the Super Bowl? Hope you all enjoy the game!
Thanks for reading and let me know your thoughts in the comments!