Merry Christmas everyone! Today I wanted to look at some data for the season, discuss takeaways for the Pittsburgh Steelers Week 16 matchup against the Kansas City Chiefs on Sunday afternoon, and pose some questions for you the readers.
First, let’s look at NFL receiving yards leaders:
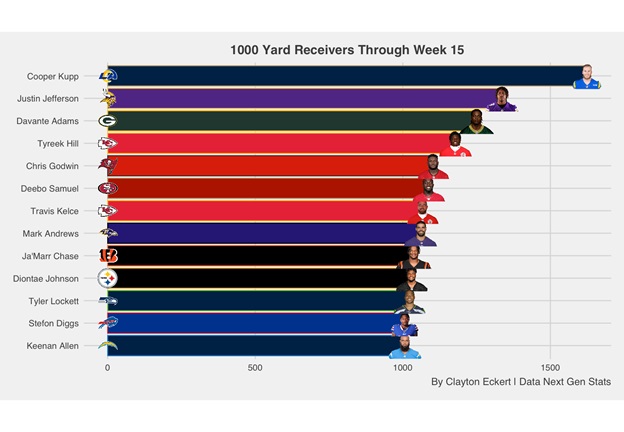
Chiefs wide receiver Tyreek Hill and tight end Travis Kelce both land on the list, impressively the only team with two such receivers! The biggest factor of the game is their availability, with both on the COVID list and both at risk to miss their first game of the season! It will be very interesting to see how this shakes out, and how both teams game plan and scheme around this Sunday afternoon. Steelers wide receiver Diontae Johnson also makes the list ranking 10th in the NFL!
Let’s look at quarterbacks with the following data points from Next Gen Stats:
- Completed Air Yards = Average air yards a passer throws on completions
- Intended Air Yards = Average air yards a passer throws on all attempts
- Aggressiveness = Amount of pass attempts a passer makes into tight coverage, where a defender is within one yard or less of the receiver at the time of completion or incompletion as a percentage
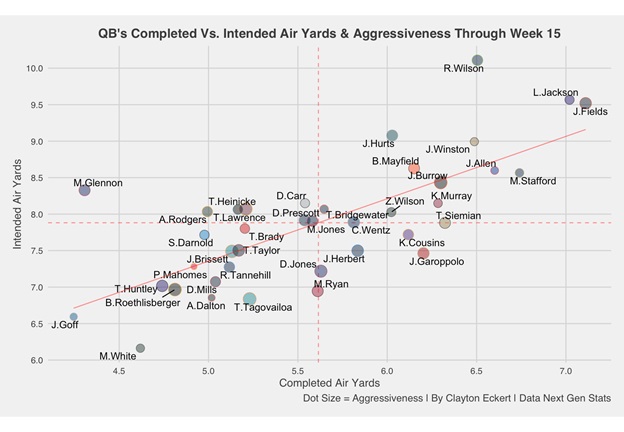
At the bottom left of the graph we can see both Steelers quarterback Ben Roethlisberger and Chiefs quarterback Patrick Mahomes, emphasizing they both have averaged less air yards than most of the other quarterbacks in the league. Roethlisberger’s completed air yards number sits at 4.8 for a 35th rank out of the 39 quarterbacks, and an intended air yards number of 7 that ranks 34th. Mahomes has a 4.9 completed air yards number which only ranks one spot higher than Roethlisberger at 34th, along with a higher 7.3 intended air yards number that ranks 29th.
The dot sizes highlight a big difference in their throws, with Roethlisberger ranking second in aggressiveness, throwing into tight coverage 19.2% of the time! In comparison, Mahomes has the lowest aggressiveness percentage in the NFL at 8.9%! So, while Mahomes doesn’t top the chart in air yards, he takes what the defense gives him and reads coverage well overall on his decisions. Having a variety of quality targets definitely helps, and his ability to extend the play also helps his playmakers get open with space to make something happen. Tackling the catch will be a huge factor for the Pittsburgh defense and a key factor in the game, especially if Hill and/or Kelce are able to suit up.
Let’s look at overall quarterback statistics:
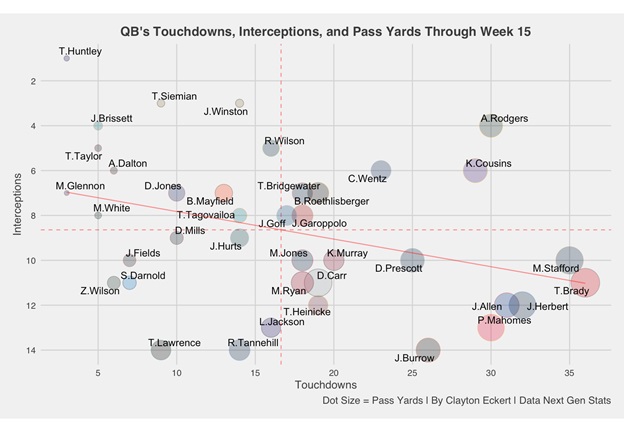
Mahomes lands on the right of the graph, one of six quarterbacks with 30 touchdowns! Of those players he has the most interceptions, highlighting the shaky start and miscues/drops from receivers with eight of those 13 interceptions coming in the first six games. He also has two 400+ yard performances in his last five games and one of five quarterbacks with 4,000 yards (4,052) on the season which ranks fifth in the league. Roethlisberger lands in the middle of the graph, above the mean in both touchdowns (19) and interceptions (7) along with 3,214 yards that ranks 12th in the NFL!
I was also curious to see how the quarterbacks have done on their throws with the following data points from Sports Info Solutions:
- On Target % = The number of on target throws divided by total pass attempts (excluding spikes, throwaways, miscommunications, receiver slips, and batted passes)
- Catchable % = Percentage of passes that were deemed catchable (excluding spikes, throwaways, and miscommunications and including defensed accurate passes
- Completion %
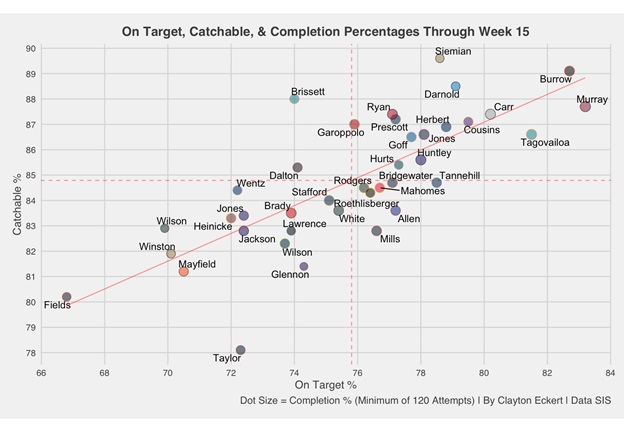
If we look at the middle of the graph, we can see both quarterbacks in this matchup just above the mean in on target % and slightly below the mean in catchable %, with Mahomes having the slight edge in both data points. He has an on target result of 76.7% that ranks 18th, 84.5% catchable throws which ranks 20th, and an overall completion percentage of 65.6% that is also 20th. In comparison, Roethlisberger’s on target percentage is 76.4% (20th), 84.3% catchable (23rd), and 65.2% overall (23rd). Each result only differs by decimals, highlighting the resurgence of the Chiefs offense and ups and downs from the Steelers offense this season.
How will the quarterbacks fare in the game?
Next let’s look at the running backs:
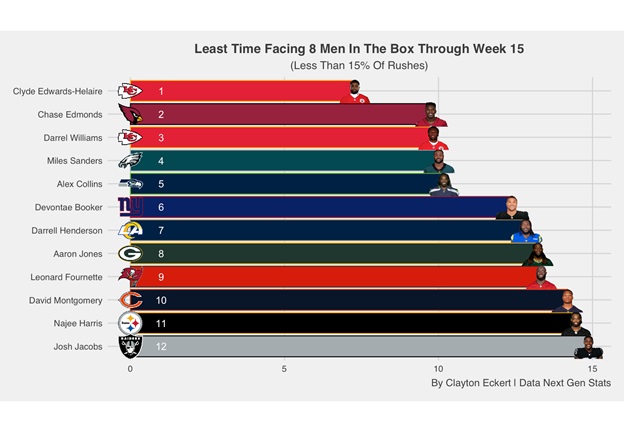
The Chiefs have two running backs in the top three of least eight men in the box percentage, highlighting that defenses have schemed to their dangerous passing attack when their offense is at full health. Depending on the COVID news, we could see a change in the Chiefs offensive game plan, with more focus on the run. Not a bad idea in my opinion if this is the case against a historically bad Steelers run defense that will also be without defensive lineman Chris Wormley and possibly Isaiah Buggs (COVID), linebackers Devin Bush (COVID), Marcus Allen (COVID), and Buddy Johnson (limited) but defensive lineman Montravius Adams was activated off the COVID list and could aid the loss of Wormley if he is able to return.
Now let’s look at the running backs average rushing yards, rush attempts, along with rush yards over expected per attempt:
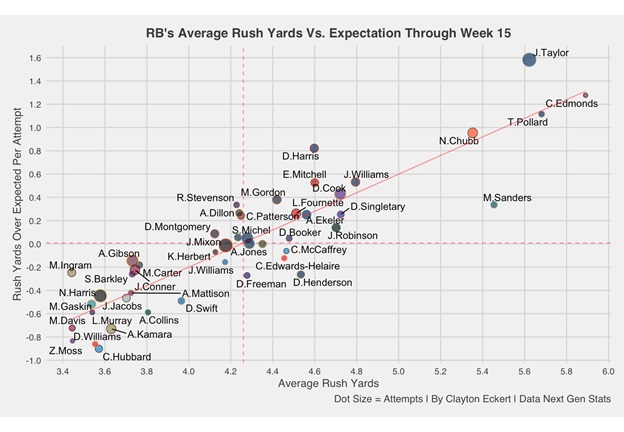
Chiefs running back Clyde Edwards-Helaire lands at the bottom middle of the graph, above the mean with 4.5 average rush yards on his 110 attempts and slightly below the mean of 0 rush yards over expected at -0.1 per attempt. He has 490 rushing yards on the season along with 3 touchdowns. Darrel Williams is his primary running mate, but lands at the very bottom left of the graph. His average rush yards sit at 3.6 with a rush yards over expected number of -0.9 per attempt, with two more carries (112) and one more touchdown (4) than Edwards-Helaire on his 398 rushing yards.
Steelers running back Najee Harris also lands on the bottom left, but a higher rush yards over expected number than Williams (-0.4), and a 3.6 average rush yards number. Harris is third in the NFL in rush attempts (249) for 891 rush yards and six touchdowns. Harris is second in the NFL in receiving targets (80) and also tied for second in receptions (62) for 405 yards (5th). Williams leads the backs in receiving on 45 targets, 38 receptions and 373 yards, but he has played in five more games than Edwards-Helaire who has 21 targets, 18 receptions, and 125 yards.
Which running back will have the strongest game?
Now let’s look at wide receivers, starting with a separation takeaway:
- Separation = Distance in yards measured between a wide receiver and the nearest defender at the time of catch or incompletion
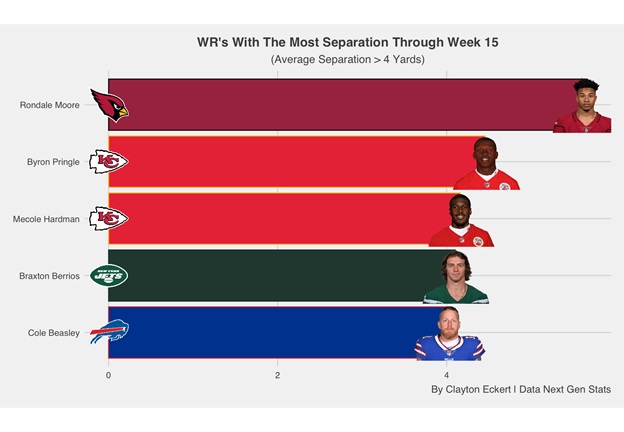
Two Kansas City wide receivers make the top three in separation, Byron Pringle and Mecole Hardman. This result largely has to do with defenses focusing their coverage to the stars but wanted to provide the information and think it could still be a factor we see in the game with both having good athleticism, and wouldn’t be surprised if Hardman can get past the Steelers defense with his impressive speed (4.33 40 yard dash in the 2019 draft).
Now let’s look at a wide receiver matchup view:
- Average YAC (yards after catch)
- YAC Above Expectation = Average YAC – YAC Above Expectation (uses tracking data such as how open the receiver is, how fast they’re traveling, how many defenders/blockers are in space, etc.)
- Percent Of Teams Air Yards = Sum of the receivers total intended air yards (all attempts) over the sum of his team’s total intended air yards as a percentage
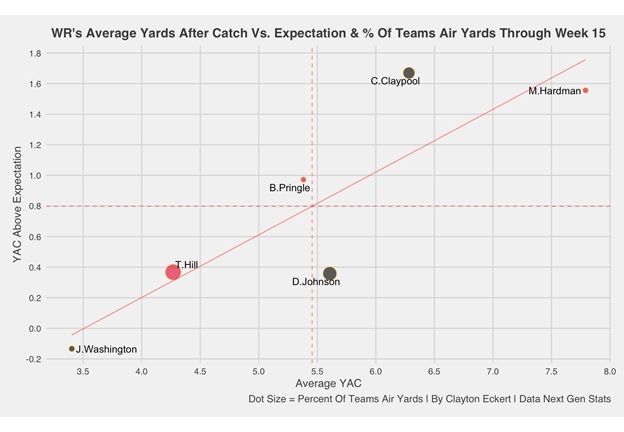
Right away we see Hardman leads in average YAC (7.79!) and second ranked YAC above expectation of 1.55 in the matchup, adding additional context to the possibility of him getting free and how important tackling the catch is in the game for the Steelers defense. He has 47 receptions on 66 targets this season for the top ranked completion percentage (71.2), accounting for 12.38% of team air yards with 506 yards and one touchdown.
Steelers wide receiver Chase Claypool leads in YAC above expectation (1.67) for the matchup and second ranked average YAC (6.3), with the same number of receptions as Hardman, but 17 more targets (83) for the lowest ranked completion percentage of these six players (56.6%)! He has accounted for 27.8% of teams air yards with 753 yards (3rd) and also one touchdown. It will be interesting to see if he can provide a YAC spark in this one.
Hill leads the bunch with 38.3% of teams air yards, receptions (102), targets (144), yards (1178), and touchdowns (9) along with a catch percentage of 70.8 (2nd) and ranks 4th in both average YAC (4.27) and YAC above expectation (0.37). In comparison, Pittsburgh wide receiver Diontae Johnson is ranked third in average YAC (5.6) and the fourth ranked YAC above expectation (0.36), and ranks second to Hill in targets (135), receptions (86), percent of teams air yards (33.11%), yards (1,028), touchdowns (6) along with his 63.7 completion percentage (4th).
Pringle is fourth in average YAC (5.38) and third in YAC above expectation (0.97) on 28 receptions and 41 targets for a 68.3 completion percentage with 402 yards and three touchdowns, which ranks 3rd in the matchup! Steelers wide receiver James Washington lands at the bottom left with the lowest ranked average YAC (3.4) and YAC above expectation (-0.13), with the same number of targets (41) but lowest amount of catches (24) and yards (285), and fifth ranked completion percentage of 58.54 with two touchdowns.
Josh Gordon is another Chiefs receiver that could be a factor if Hill is out, but has only garnered nine targets in nine games with one touchdown, so it will definitely be interesting to see which wide receivers get opportunities on Sunday.
Which wide receivers will excel in the matchup?
Next, let’s look at the same data points for tight ends across the NFL:
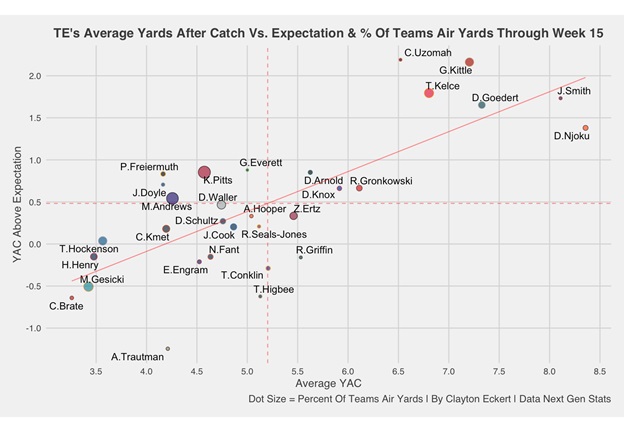
Right away we can see Kelce on the top right along with six other tight ends that have exceled after the catch, ranking fifth out of the 31 players on the graph with an average YAC of 6.8 along with a third rank YAC above expectation (1.8)! Also, he ranks third in teams air yards (23.08%), tied for first in targets (122!) and second in receptions (83) but a lower 68.03 catch percentage (15th) along with 850 yards (3rd) and seven touchdowns (T-3rd). If he is ruled out, backup tight end Blake Bell will likely see and increased workload if available.
Steelers tight end Pat Freiermuth ranks 26th in average YAC, but is above expectation at 0.83 for a 10th overall rank! He has 10.99% of the teams air yards (17th) on his 422 yards, with 64 targets (16th) and 49 receptions (T-12th) for a 76.56 catch percentage that ranks fourth! He has an impressive seven touchdowns (T-3rd), but he has unfortunately been ruled out for the game. This gives tight ends Zach Gentry and Kevin Rader opportunities, and it will be interesting to see how they perform.
Will the Steelers struggle without Freiermuth? How will the Chiefs fare if Kelce doesn’t play?
Now let’s look at the offensive lines with blocking grades from Pro Football Focus:
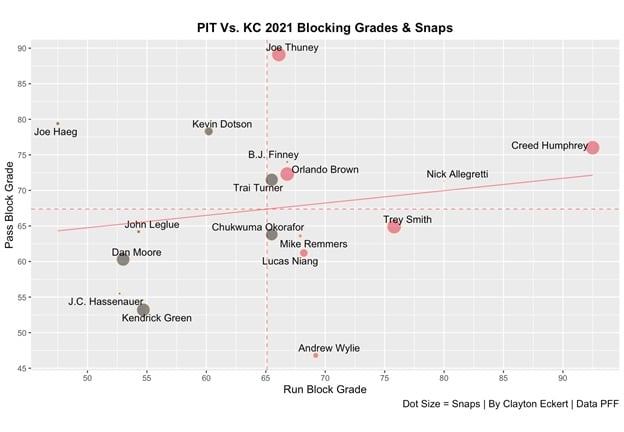
Chiefs rookie center Creed Humphrey leads the graph in run blocking with a 92.5 grade, along with a 76 pass blocking grade and is the top ranked center in the league with a 90.4 offensive grade! Guard Joe Thuney has an impressive 89.1 pass block grade along with his 66.1 grade as a run blocker. Fellow guard Trey Smith is below the mean as a pass blocker but has a 75.8 run block grade. Orlando Brown is the Chiefs left tackle who is above the mean as both a run and pass blocker. Similar to the Steelers, the Chiefs have had injuries on the line with tackle Lucas Niang getting the most snaps at the spot but currently on the COVID list along with offensive lineman Mike Remmers, and it will be interesting to see what their lineup looks like on Sunday.
Steelers guard Trai Turner is the only starting lineman that is above the mean in both data points for the team, with a 71.5 pass block grade along with a 65.5 grade as a run blocker. Pittsburgh right tackle Chukwuma Okorafor is also above the mean with a 65.5 run block grade, but below the mean as a pass blocker at 63.8. Left tackle Dan Moore is below the mean in both data points along with center Kendrick Green for the Steelers, the former with a poor run blocking grade at 53 along with a 60.3 pass block grade, and the latter with poor grades of 54.7 as a run blocker and 53.2 in pass blocking. John Leglue will likely get his third start at left guard for Pittsburgh and has had ups and downs with a 64.2 pass block grade and a 54.3 grade as a run blocker, but Steelers guard Kevin Dotson resumed practice this week and could return soon but unlikely for this matchup.
How do you think the offensive lines will perform?
To wrap up, let’s look at expected points added (EPA) for offense and defense:
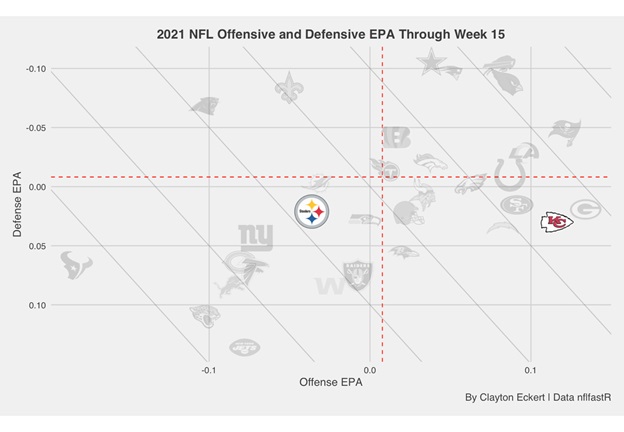
The Chiefs land on the right of the graph with the third ranked offense in EPA, which has moved up drastically as the season has progressed! Their defense is below the mean but has also improved through the season and currently ranks 21st. Pittsburgh ranks 18th in defensive EPA along with a 23rd rank on offense with both below the mean in the NFL.
Chiefs linebacker Nick Bolton leads the team with 102 combined tackles but is another player on the COVID list that could miss the game. Dominant defensive tackle Chris Jones leads the team with seven sacks and will likely give Pittsburgh’s interior offensive line fits. Safety Tyrann Mathieu leads the team with three interceptions, and cornerback Charvarius Ward has the most passes defended with eight. Former Steelers linebacker Melvin Ingram will be looking to make his presence felt, and it will be interesting to see how much he plays and how he fares.
Here’s to hoping the Steelers can provide a fantastic late Christmas gift to Steelers Nation with a win! How do you see this game playing out?
Thanks for reading and let me know your thoughts in the comments!