Today I am continuing my “Wide Receiver Study Series”, this being the third and final article of the series. Here are the links to the first two studies that I would recommend for full context of this study:
In the first two studies, we looked at the Wide Receivers EPA/Success in the 2020 regular season, then the last 5 years based on these stat points:
- Air Yards/comp = Numeric value for distance in yards perpendicular to the line of scrimmage at where the targeted receiver caught the ball.
- YAC (Yards After Catch) = Numeric value for distance in yards perpendicular to the yard line where the receiver made the reception to where the play ended.
- complete_pass (Catch) = Binary indicator for if the pass was completed.
Today let’s look at 2016-2020 playoffs similar to how I wrapped up the second study with the bulleted data points above. With that in mind, let’s see what 2016-2020 looked like:
NOTE: Team logos are for the players last playoff team so we can see if they had consistent success with one team, or changed teams for this study.

The goal here was to get value from various important elements: winning, receiving, usage, and team success. Also, we can see which Wide Receivers had the most opportunity with team success and capitalized on it, along with seeing which players were mostly a product of being on a successful team rather than being a primary reason for them getting to and lasting in the playoffs. For example, there are three players from the Patriots, Edelman being the primary contributor (and none are on the team any longer). Another takeaway I enjoyed was looking at the Chiefs. Watkins leads this study in Air Yards/completion while also nearly matching Hill in Yards After Catch. This is not surprising considering that defenses double team and bracket Hill (especially in the playoffs), along with the attention Travis Kelce gets, this leaves opportunities for others like Watkins to provide this value. It will be interesting to see how he does with the Ravens receiving corps with all of this in mind.
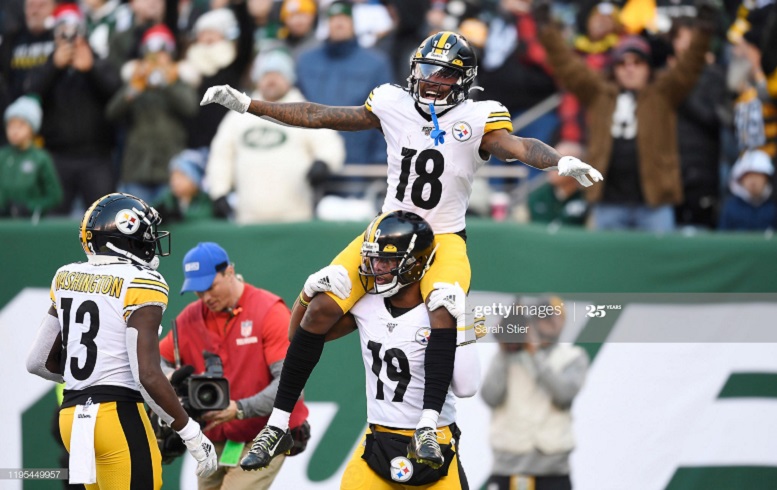
Through Steelers lenses, this study reminds us of the Antonio Brown years. I was surprised to see him land #1 in Playoff YAC, especially with some of the other names on the graph (and I was a huge AB fan). His departure was one of the most shocking things as far as my personal Steelers fandom. What a crazy journey he’s had since then, makes me wonder how different the top receivers talk would be today if he stayed in Pittsburgh.
Since we are layering this information to get more value out of it and perhaps learn something about how we’ve previously thought about players, this study will bring all studies into focus for a clearer final view (Study 2.0 Air Yards/YAC heavier, Study 1.0 EPA/success higher). Now, let’s rank them by stats similarly to last time, but with the 5 year playoff sample size, and adding some new value: We’ll use Playoff Catch data to give us value from a making catches in winning situations perspective, Playoff Air Yards for downfield value in winning situations, Playoff YAC for creating yards in winning situations, then Study 1.0 ranks (2020 EPA/success), and Study 2.0 ranks (2016-2020 Air Yards/YAC):
| Playoff Catch Rk (2016-2020) | Playoff Air Yards Rk (2016-2020) | Playoff YAC Rk (2016-2020) | Study 1.0 Rk | Study 2.0 Rk |
|---|---|---|---|---|
| 1. T.Hill | 14 | 2 | 3 | 1 |
| 2. D.Adams | 13 | 5 | 2 | 2 |
| 3. J.Edelman | 7 | 4 | 29 | |
| 4. M.Thomas | 10 | 9 | 11 | |
| 5. S.Diggs | 6 | 8 | 1 | 3 |
| 6. R.Woods | 12 | 14 | 32 | 18 |
| 7. D.Amendola | 11 | 10 | 35 | |
| 8. C.Hogan | 2 | 13 | ||
| 9. An.Brown | 9 | 1 | 10 | |
| 10. D.Hopkins | 8 | 15 | 7 | 7 |
| 11. B.Cooks | 4 | 11 | 12 | 6 |
| 12. S.Watkins | 1 | 3 | ||
| 13. C.Beasley | 15 | 6 | 10 | 19 |
| 14. A.Jeffery | 3 | 12 | ||
| 15. J.Landry | 16 | 7 | 13 | 8 |
| 16. A.Thielen | 5 | 16 | 20 | 14 |
Hill and Adams continue to show up at the top of the list as they have through most of the studies. Diggs also gives great value with top 10 ranks across the board. The final rankings below are based on a formula I created, and I’ll give you the short explanation: how many studies did the player rank in (for overall value), what was their average rank across the studies (for quality), and how many separate years did they rank highly in yardage since 2018 (for consistency/availability/longevity), along with various tiebreakers that were mentioned across all 3 studies. With all of this in mind, here are my final “Wide Receiver Performance Rankings by 2016-2020 Regular Season + Playoffs”:
| Study 3.0 Rank (all studies combined rank) |
|---|
| 1. T.Hill |
| 2. D.Adams |
| 3. S.Diggs |
| 4. D.Hopkins |
| 5. M.Evans |
| 6. M.Thomas |
| 7. J.Jones |
| 8. B.Cooks |
| 9. J.Landry |
| 10. A.Thielen |
| 11. Antonio Brown |
| 12. A.Cooper |
| 13 C.Ridley |
| 14. C.Beasley |
| 15. R.Woods |
| 16. D.Moore |
| 17. D.Metcalf |
| 18. J.Jefferson |
| 19. J.Edelman |
| 20. T.Lockett |
| 21. C.Kupp |
| 22. C.Godwin |
| 23. K.Allen |
| 24. J.Smith-Schuster |
| 25. T.Hilton |
| 26. A.Robinson |
| 27. D.Parker |
| 28. D.Amendola |
| 29. A.J. Brown |
| 30. O.Beckham |
| 31. G.Tate |
| 32. M.Jones |
| 33. J.Crowder |
| 34. T.McLaurin |
| 35. R.Anderson |
| 36. E.Sanders |
| 37. C.Claypool |
| 38. C.Lamb |
| 39. L.Fitzgerald |
| 40. T.Higgins |
| 41. T.Boyd |
| 42. R.Cobb |
| 43. D.Johnson |
| 44. S.Shepard |
| 45. A.Humphries |
| 46. M.Brown |
| 47. M.Sanu |
| 48. M.Gallup |
| 49. R.Gage |
| 50. B.Aiyuk |
| 51. C.Samuel |
| 52. D.Mooney |
| 53. J.Jeudy |
| 54. A.Green |
| 55. D.Slayton |
| 56. S.Watkins |
| 57. C.Hogan |
| 58. A.Jeffery |
I really feel good about this final list and the data points used to put this study together. This will most likely be the final study on the Wide Receivers for now, until the 2021 season begins so we can filter that info in and see how the pass game performs. Thanks for reading and let me know your thoughts in the comments!