Today I am continuing my “Tight End Study Series”, this being the third and final article of the series. Here are the links to the first two studies that I would recommend for full context of this study:
In the first two studies, we looked at the tight ends EPA/Success in the 2020 regular season, then the last five years based on these stat points:
- Air Yards/comp = Numeric value for distance in yards perpendicular to the line of scrimmage at where the targeted receiver caught the ball.
- YAC (Yards After Catch) = Numeric value for distance in yards perpendicular to the yard line where the receiver made the reception to where the play ended.
- complete_pass (Catch) = Binary indicator for if the pass was completed.
- RBLK = Pro Football Focus Grade for Run Blocking
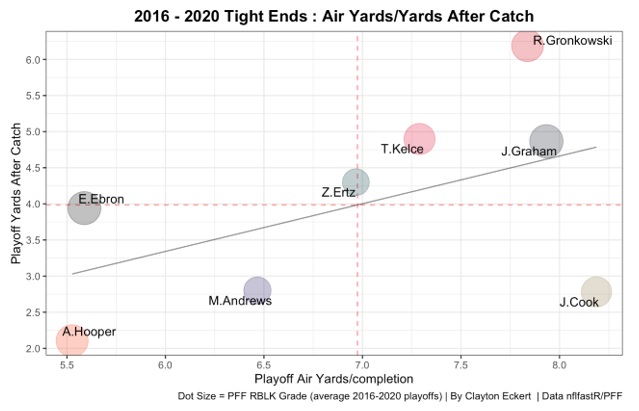
Today let’s look at 2016-2020 playoffs similar to how I wrapped up the second study with the bulleted data points above. With that in mind, let’s see what 2016-2020 looked like:
My immediate takeaway when putting the graph together was that there were less names than expected. If I filtered it to have more players, it gave too much credit to players with less opportunity in my humble opinion. To me, this seemed to be more consistent to how I did the other positions through my studies (even though this graph alone looks a little sparse). Gronkowski and Kelce landed on the top right of the graph again, solidifying that they’ve been very valuable to their teams. Jimmy Graham also joins them in the top right, providing great value at their position.
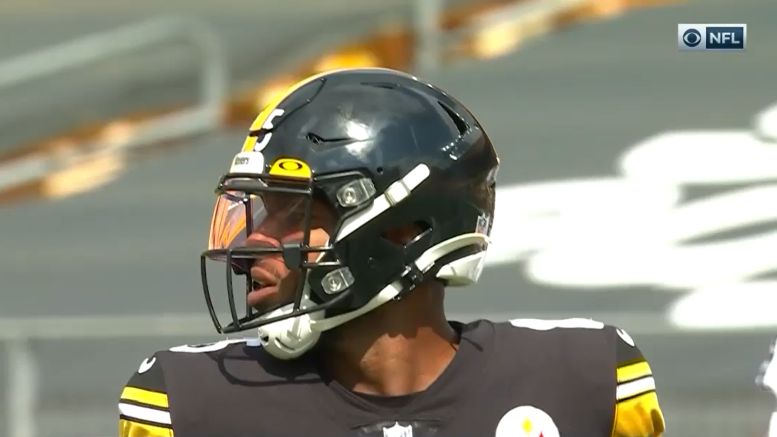
Now for an unexpected takeaway, the Pro Football Focus RBLK Grades. I was very surprised to see Eric Ebron’s high ranking out of these players (second), especially with the common narrative of him being much more of a receiver than a blocker (FLEX TE). The extremely surprising element is that the game that brought his five-year average up was the 2020 Steelers playoff game. As I pondered the PFF grades, the sample size of playoff games only makes me think that results could be different than the common narrative, but still very important in winning situations. Also, strength of competition comes to mind as a possibility to bring the perceived strongest blockers down the ranks a bit compared to the regular season. No matter if you agree or disagree with PFF grades, we can definitely learn something and form our own opinions in the process.
With that in mind, let’s look at the film for these plays:
Eric Ebron #85: 2020 Wildcard Playoff Game Run Blocking Plays (Game Order)
Block 1
Let’s start with my favorite, Ebron starts on the right side of the formation and pulls behind JuJu going in motion. He keeps the defensive end from getting to Conner and is a big reason the play is successful.
Block 2
Here Ebron is split out wide at the bottom of the screen. He shows good effort staying engaged with the corner.
Block 3
Ebron sells a route over the middle setting up his block. He gets his hands on #93 of the Browns, but since the defender sees it is a run and has his momentum started, he takes on the block well.
Block 4
Split out at the bottom of the screen, Ebron should get his arms more extended and lets up on his effort to early in the play. There are other issues on this play, but the focus here is Ebron.
Block 5
On this play he starts off the line of scrimmage and gets a running start to engage Myles Garrett. This works in short yardage situations where the play is developing fast.
Block 6
Here is my favorite effort block, he gets good leg drive after initial contact. Then he falls off the block when the defender counters, so a mixed bag.
Block 7
On his final run block snap, the defender gets a great punch to his chest, causing him to lose his footing and gets blocked to the ground. Thank goodness Feiler was pulling, and James Washington sells his route keeping the corner out of the play.
My takeaway after the film is that in the small sample size, he has what I consider three positive plays, and the other four average or negative plays. In grade terms that would put me slightly below PFF’s opinion but in the same range. With that in mind, let’s bring our focus back to all the tight ends.
Since we are layering this information to get more value out of it and perhaps learn something about how we’ve previously thought about players, this study will bring all studies into focus for a clearer final view. Now, let’s rank them by stats similarly to last time, but with the five-year playoff sample size, and adding some new value: We’ll use Playoff Catch data to give us value from a making catches in winning situations perspective, Playoff PFF RBLK Ranks for run blocking value in winning situations, Playoff Air Yards for downfield value in winning situations, Playoff YAC for creating yards in winning situations, then Study 1.0 ranks (2020 EPA/success), and Study 2.0 ranks (2016-2020 Complete Pass/Air Yards/YAC/RBLK):
| Playoff Catch Rank (2016-2020) | Playoff PFF RBLK Rank (2016-2020) | Playoff Air Yards Rank (2016-2020) | Playoff YAC Rank (2016-2020) | Study 1.0 Rank | Study 2.0 Rank |
| 1. T.Kelce | 5 | 4 | 2 | 1 | 1 |
| 2. R.Gronkowski | 4 | 3 | 1 | 5 | 2 |
| 3. J.Cook | 6 | 1 | 7 | 15 | 10 |
| 4. Z.Ertz | 8 | 5 | 4 | 30 | 24 |
| 5. A.Hooper | 3 | 8 | 8 | 4 | 7 |
| 6. E.Ebron | 2 | 7 | 5 | 21 | 16 |
| 7. J.Graham | 1 | 2 | 3 | 8 | 6 |
| 8. M.Andrews | 7 | 6 | 6 | 13 | 5 |
Kelce and Gronkowski were the only Tight Ends that had top five ranks across the table, while Austin Hooper and Jimmy Graham also provide great value with top ten ranks. The final rankings below are based on a formula I created, and I’ll give you the short explanation: how many studies did the player rank in (for overall value), what was their average rank across the studies (for quality), and how many separate years did they rank highly in run blocking snaps since 2018 (for well-rounded value), along with various tiebreakers that were mentioned across all three studies. With all of this in mind, here are my final “Tight End Study Rankings by 2016-2020 Regular Season + Playoffs”:
| Study 3.0 Ranks |
| 1. T.Kelce |
| 2. R.Gronkowski |
| 3. G.Kittle |
| 4. A.Hooper |
| 5. H.Henry |
| 6. J.Graham |
| 7. M.Andrews |
| 8. J.Cook |
| 9. D.Waller |
| 10. T.Higbee |
| 11. J.Smith |
| 12. J.Doyle |
| 13. Z.Ertz |
| 14. E.Ebron |
| 15. M.Gesicki |
| 16. K.Rudolph |
| 17. D.Schultz |
| 18. R.Tonyan |
| 19. T.Hockenson |
| 20. C.Clay |
| 21. D.Goedert |
| 22. H.Hurst |
| 23. G.Olsen |
| 24. V.McDonald |
| 25. D.Knox |
| 26. E.Engram |
| 27. L.Thomas |
| 28. V.Davis |
| 29. J.Witten |
| 30. G.Everett |
| 31. N.Fant |
| 32. C.Brate |
| 33. A.Firkser |
| 34. D.Walker |
| 35. T.Eifert |
| 36. D.Sample |
| 37. T.Burton |
| 38. J.James |
| 39. D.Arnold |
| 40. J.Reed |
| 41. R.Griffin |
| 42. C.Kmet |
I really feel good about this final list and the data points used to put this study together. I am so excited the preseason is near so we can see how the tight ends perform. Thanks for reading and let me know your thoughts in the comments!


