Today I am continuing my “Running Back Study Series”, here is a link to the first study that I would recommend for full context of this study:
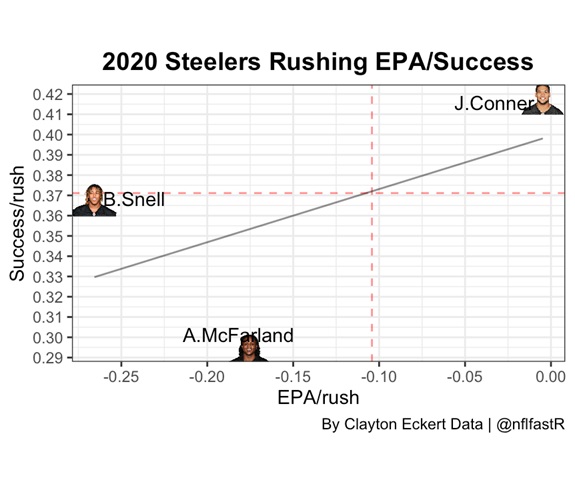
Before we fully dive into this study, I wanted to start on a Steeler-specific graph. Since we will have to wait and see what Najee Harris can do in the NFL, I wanted to visualize the point I was making in Study 1.0: When James Conner wasn’t playing, the running game struggled more. Yes, there are many other factors that can cause this (offensive line, scheme, team success), but it’s not a coincidence either. After all, successful running backs need to make the most of whatever opportunities are there when rushing. Here’s a graph of the Steelers’ primary running backs for 2020:
For 2021, inserting Najee (who I view can take on the “bellcow” role more successfully) for Conner and hopeful scheme improvements with Matt Canada have me optimistic that the 2021 offense will be closer to the first half of the 2020 season as opposed to the latter half. I believe Harris has the overall skills to succeed, even in less than ideal situations (ex. eluding defenders in the backfield) with burst/power/size rushing, along with overall skills in the pass game, and defenses will have to account for him (compared to the lack of rush threat at the end of 2020). That should open up the offense if he doesn’t miss much time.
Now, let’s transition back to a league view for Study 2.0.
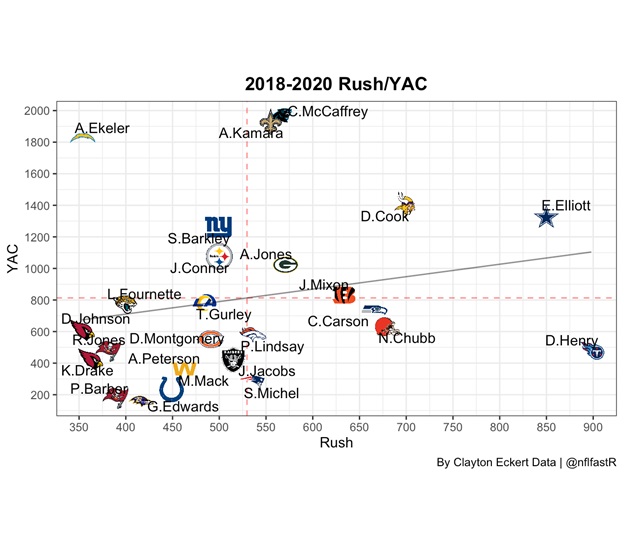
Today I wanted to dive a little deeper and get a broader view than a single season. I also wanted to add some receiving value, while keeping longevity/durability/usage factors in the run game by digging back three years (compared to five years in my quarterback Study, since the average career length of running backs are shorter generally speaking). Here are definitions for the data points:
- Rush = binary indicator if the play was a rushing play
- YAC = yards after catch
With that in mind, let’s see what 2018-2020 looked like:
NOTE: Team logos are for 2018 so we can see if the running back had consistent success with one team, or has changed teams for this study.
Yay receiving value! This chart allows us to get a wider view of the total picture on offense. This made me want to address a common question, “are running backs fungible?”. My take is if your team approach is “rusher by committee” (2 or more primary rushers), yes. There are many more names that could have made the graph above that would have cluttered the middle and lower left of this graph. The way the Steelers have preferred to employ running backs is the “bellcow” approach (1 primary rusher).
Look at the leaders in the top/right of the graph for example: Henry, Elliott, Cook, McCaffrey, and Kamara all happen to be earlier draft picks (Day 1 or 2)! That is a high bar, but I loved the decision to pick Najee in the first round because he fits the team approach the Steelers want, along with a well-rounded skill set that allows him to stay on the field and provide value in a variety of ways (barring injury). With all of these things in mind, and it lines up with team need, it’s exciting and not as fungible in my opinion.
Now for a fun table from the information from the graph above, then incorporating Study 1.0 ranks:
| 2018-2020 Rush Rank (n_rush) | 2018-2020 YAC Rank | Study 1.0 Rank (2020 Rushing EPA/Success) |
|---|---|---|
| 1. D.Henry | 18 | 1 |
| 2. E.Elliott | 5 | 7 |
| 3. D.Cook | 4 | 2 |
| 4. N.Chubb | 13 | 13 |
| 5. C.Carson | 12 | 25 |
| 6. J.Mixon | 9 | |
| 7. A.Jones | 8 | 4 |
| 8. C.McCaffrey | 1 | |
| 9. A.Kamara | 2 | 6 |
| 10. P.Lindsay | 15 | |
| 11. S.Michel | 22 | |
| 12. J.Jacobs | 20 | 11 |
| 13. J.Conner | 7 | 10 |
| 14. S.Barkley | 6 | |
| 15. D.Montgomery | 16 | 17 |
| 16. T.Gurley | 10 | 20 |
| 17. A.Peterson | 21 | |
| 18. M.Mack | 23 | |
| 19. G.Edwards | 25 | 24 |
| 20. L.Fournette | 11 | |
| 21. P.Barber | 24 | |
| 22. R.Jones | 17 | 5 |
| 23. K.Drake | 19 | 19 |
| 24. A.Ekeler | 3 | |
| 25. D. Johnson | 14 | 22 |
I love the context this got in regard to broader value and giving credit where it is due. To answer more questions than we did in the first study, I did a ranking with this study for something more concise to wrap up:
| Study 2.0 Rank (2018-2020 Running Back Rushing/Receiving/Usage Rankings) |
|---|
| 1. D.Cook |
| 2. C.McCaffrey |
| 3. E.Elliott |
| 4. A.Kamara |
| 5. A.Jones |
| 6. D.Henry |
| 7. J.Mixon |
| 8. N.Chubb |
| 9. J.Conner |
| 10. S.Barkley |
| 11. P.Lindsay |
| 12. A.Ekeler |
| 13. C.Carson |
| 14. J.Jacobs |
| 15. R.Jones |
| 16. T.Gurley |
| 17. L.Fournette |
| 18. D.Montgomery |
| 19. S.Michel |
| 20. A.Peterson |
| 21. K.Drake |
| 22. D. Johnson |
| 23. M.Mack |
| 24. P.Barber |
| 25. G.Edwards |
For the next study, I will add playoff value similar to my “Quarterback Study Series” and wrap up the series with more visualizations. Hopefully you enjoyed! Let me know your thoughts in the comments!

