Today I am continuing my “Running Back Study Series”, this being the third and final article of the series. Here are the links to the first two studies that I would recommend for full context of this study:
In the first two studies, we looked at rushing EPA/Success in the 2020 regular season, then the last 3 years based on two stat points:
- Rush = binary indicator if the play was a rushing play
- YAC = yards after catch
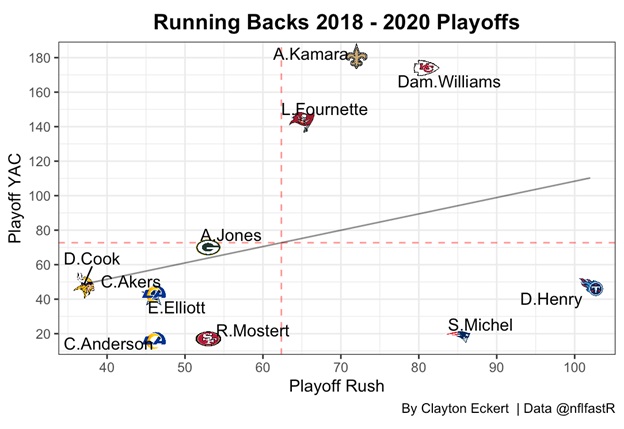
Today let’s look at 2018-2020 playoffs similar to how I wrapped up the second study with the bulleted data points above:
The goal here was to get value from various important elements: winning, rushing, receiving, usage, and team success. Also, we can see which rushers had the most opportunity with team success and capitalized on it, along with the lower left players in the graph to see which players were mostly a product of being on a successful team rather than being a primary reason for them getting to and lasting in the playoffs (fungible). Look at the Rams for example, two players made the bottom left, but many other backs could have achieved their results (or better) if put in the same situation. A fun hypothetical question: What if Elliott or Cook played for the Rams? They just haven’t had the same successful playoff situations from 2018-2020 as arguably everyone else in this graph, but are two of the highest ranked backs in my studies otherwise.
Unfortunately for Steelers fans, this study reminds us of the lack of playoffs, and how important it was to invest in the offense. If you think the running back you’re drafting is special, and your team uses a “bellcow” approach, I believe what round is just a number. Especially if that back can be versatile enough to make defenses have to guess run or pass more, this helps the entire offense do their jobs more successfully. The offensive line creates holes for the back for easier rushing opportunities, but the backs versatility can keep the defense guessing for that split second at the snap potentially making the offensive lineman’s block an easier opportunity also.
Since we are layering this information to get more value out of it and perhaps learn something about how we’ve previously thought about players, this study will bring all studies into focus for a clearer final view (Study 2.0 weighed receiving heavier, Study 1.0 weighed rushing higher). Now, let’s rank them by stats similarly to last time, but with the 3 year playoff sample size, and adding some new value: We’ll use “Playoff Rush” data from the graph to give us value from a rush usage in winning situations perspective, then by receiving value (YAC) in winning situations, then Study 1.0 ranks (2020 rushing usage/success), and Study 2.0 ranks (2018-2020 rushing/receiving/usage):
| ’18-’20 Playoff Rush Rk | ’18-’20 Playoff YAC Rk | Study 1.0 Rk | Study 2.0 Rk |
|---|---|---|---|
| 1. Derrick Henry | 6 | 1 | 6 |
| 2. Sony Michel | 9 | 19 | |
| 3. Damien Williams | 2 | ||
| 4. Alvin Kamara | 1 | 6 | 4 |
| 5. Leonard Fournette | 3 | 17 | |
| 6. Aaron Jones | 4 | 4 | 5 |
| 7. Raheem Mostert | 10 | ||
| 8. Ezekiel Elliott | 7 | 7 | 3 |
| 9. Cam Akers | 8 | ||
| 10. C.J. Anderson | 11 | ||
| 11. Dalvin Cook | 5 | 2 | 1 |
Layering in the previous studies in the above table really helped to get more context across all the studies. For example, James Conner ranked very well in the first two studies, but fell in this study since it incorporated winning and availability the last three years (very important elements for team success in a “bellcow” scheme). There are more factors taken into account than the Quarterback Study, so the final rankings below are based on a formula I created and I’ll give you the short explanation: how many studies did the player rank in (for versatility), what was their average rank across the studies (for quality), and how many separate years did they rank highly in yardage since 2018 (for consistency/availability/longevity), along with various tiebreakers that were mentioned across all 3 studies. With all of this in mind, here are my final “Running Back Performance Rankings by 2018-2020 Regular Season + Playoffs”:
| Study 3.0 Rank (All studies final combined rank) |
|---|
| 1. Derrick Henry |
| 2. Ezekiel Elliott |
| 3. Dalvin Cook |
| 4. Alvin Kamara |
| 5. Aaron Jones |
| 6. Christian McCaffrey |
| 7. Jonathan Taylor |
| 8. Nick Chubb |
| 9. Todd Gurley |
| 10. Josh Jacobs |
| 11. David Montgomery |
| 12. Chris Carson |
| 13. Saquon Barkley |
| 14. Ronald Jones |
| 15. Melvin Gordon |
| 16. Sony Michel |
| 17. Leonard Fournette |
| 18. Joe Mixon |
| 19. James Conner |
| 20. Kareem Hunt |
| 21. Adrian Peterson |
| 22. Kenyan Drake |
| 23. David Johnson |
| 24. Philip Lindsay |
| 25. Peyton Barber |
| 26. Gus Edwards |
| 27. Austin Ekeler |
| 28. James Robinson |
| 29. Marlon Mack |
| 30. Miles Sanders |
| 31. Antonio Gibson |
| 32. Clyde Edwards-Helaire |
| 33. Wayne Gallman |
| 34. Mike Davis |
| 35. Latavius Murray |
| 36. Damien Williams |
| 37. Raheem Mostert |
| 38. Cam Akers |
| 39. C. J. Anderson |
I really feel good about this final list and the data points used to put these lists together. This will most likely be the final study on the running backs for now, until the 2021 season begins so we can filter that info in and see how the new look Steelers running game performs. Thanks for reading and let me know your thoughts in the comments!


