Pittsburgh Steelers running back James Conner certainly had a great first half of a season as the former third-round draft pick out of the University of Pittsburgh registered 1158 total yards from scrimmage in the team’s first nine regular season and that’s tops in the AFC entering Week 11. Conner’s 771 rushing yards and 10 rushing touchdowns are also currently tops in the AFC as his team prepares to play the Jacksonville Jaguars on the road Sunday.
With a few days remaining before the Steelers play the Jaguars, now is a treat time to look at Conner’s rushing stats in several different categories through nine games played and that includes his directional and success rate stats.
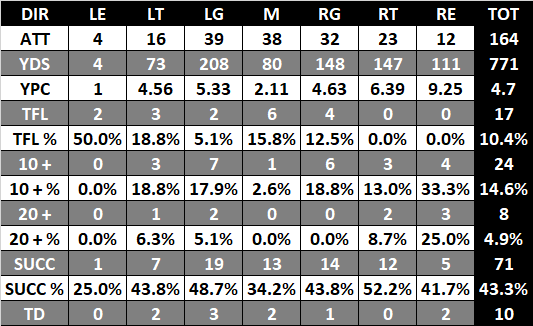
While Conner’s 4.7 yards per carry average through nine games played is quite impressive, you’ll notice in the table of stats below that he’s only averaged 2.11 yards per carry on runs that were scored as going up the middle. That also helps explain his low success rate of 34.2% on runs in that direction.
While certainly good, Conner’s overall successful run rate of 43.3% is not tops in the NFL entering Week 11. Additionally, his tackled for loss percentage of 10.4% could stand to be lowered just a bit. Those percentages, along with Conner’s robust yards per carry average, show that the running back likely busted off several big runs and the table of data below backs that up as he has already registered 24 runs of 10 yards or longer of which 8 went for 20 yards or more. By the way, Conner and San Francisco 49ers running back Matt Breida are both currently tied for the league-lead in explosive runs of 20 yards or more entering Week 11.
While the stats below certainly aren’t weighted to calculate in strength of run defenses faced, Conner has outperformed what running back Le’Veon Bell registered statistically through nine games played last season. Additionally, it’s important to remember that Bell sat out all of training camp and the preseason in 2017. Even so, Conner bested Bell’s 2017 season through nine games played in most every statistical category I track except for tackled for loss percentages.
Moving forward for Conner in the team’s final seven regular season games of 2018, it will be interesting to see if he can not only keep up his high rate of long runs but lower his percentage of tackled for a loss. We’d also like to see him perform better on runs up the middle to close out the 2018 regular season while increasing his overall successful run rate to closer to 50%.
***Successful runs are ones that gain at least 45% of yards needed on 1st down, 60% of yards needed on 2nd down and 100% of yards needed on 3rd and 4th downs.***
James Conner’s Rushing Stats – Game 1-9 2018 Season
Le’Veon Bell’s Rushing Stats – Game 1-9 2017 Season