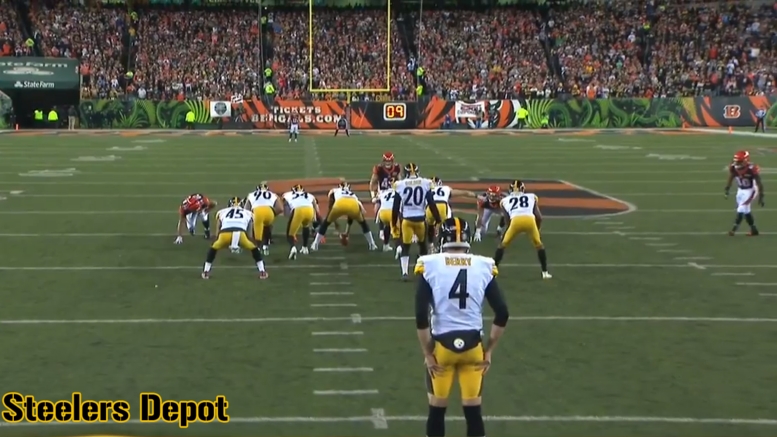
The Pittsburgh Steelers reportedly re-signed punter Jordan Berry to one-year contract on Thursday and since then there’s been a lot of talk about his overall effectiveness during the 2017 season. Earlier today, Alex Kozora posted about Berry’s directional punting this past season and how that needs to be considered when measuring his overall effectiveness. In this post, I’m going to look at Berry’s overall raw punting stats from the 2017 season and attempt to show that he isn’t as bad as those numbers might indicate he is.
Below is what I wrote on Twitter Thursday not long after it was reported that Berry was re-signed.
Of the 31 NFL punters in 2017 who had 50 or more punts during the regular season, Jordan Berry’s net average of 39.8 yards was 23rd overall. His 43.2 gross average ranked him 30th overall when compared to those same 31 punters.
If you look at that short paragraph above, it would lead you to believe that Berry wasn’t a very effective punter in 2017. In case you need a quick link to those raw stats, click here.
Now, we need to dive much deeper into his stats to get a better understanding as to why Berry’s average and net average were so low.
For starters, due to the Steelers offense effectively being able to move the football throughout the 2017 season, Berry was forced to punt quite a bit with the football on the opposition’s side of the field. In fact, 23.4% of Berry’s 64 punts during the 2017 season occurred with the original line of scrimmage being on the opponents’ side of the 50-yard-line. Only one other punter last season registered a higher percentage than Berry did when it comes to that stat and it was Dallas Cowboys punter Chris Jones (30.3%).
In short, the above stat means that on 15 of Berry’s 64 total punts last season, he didn’t have a lot of field to work with to avoid a touchback and thus he couldn’t put everything he had into booting the football distance-wise for fear of it going into the end zone. By the way, Berry only had two touchbacks last season.
As far as punts last season that resulted in the opposition taking control of the football inside their own 20-yard-line, Berry had 26 of those, or 40.6% of all his punts. Only 8 other punters who had more than 50 punts last season registered a better percentage when it came to inside-the-20 stats. This is a huge stat that shouldn’t be overlooked.
I wanted to take the inside-the-20 stat a little bit further, however. First, I wanted to see what percentage of Berry’s punts were either fielded, downed, or kicked out of bounds inside the opponents 20-yard-line and compare that to the other 30 punters. Mind you, this is not net of the punt, only where the football was either fielded initially, downed, or went out of bounds at. In total, 51.6% of Berry’s punts fit the above criteria and once again, only 8 other punters had a higher percentage than the Steelers punter did.
I did the same stat study for inside-the-10 and this time Berry’s 14.1% ranked him 16th overall of the 31 punters who registered 50 or more punts during the regular season. In short, if there’s one area that Berry needs some improvement in, it might be him being able to get the football to be fielded, downed, or out of bounds inside the opponents 10-yard-line a little more often. That said, he was still in the middle of the pack this past season when it comes to that particular stat.
In total and not including touchbacks, 60.9% of Berry’s punts last season were not returned as the football was either fair caught, downed, or when out of bounds after kicked. Only three other punters had a higher percentage than Berry did when it comes to that stat.
The last key stat I wanted to hit on is Berry’s punting averages from when he was asked to punt deep in Steelers territory (Own 1-20 yard-line). While his average of 47.4 yards ranked him near the bottom of the 31 qualifying punters when it comes to that stat, his 44-yard net-average was ranked 16th overall when compared to the other 30 punters used in this study. Ask special teams coordinator Danny Smith how important punting net-average is when kicking deep out of you own end of the field.
As you can probably see by the full table of stats that I’ve presented to you in this study, Berry certainly didn’t have a bad 2017 season. While he certainly shouldn’t be considered one of the top two or three punters in the NFL, I think he deserves to be ranked somewhere in the top ten.
| Player | Team | Punts | IN 10 | IN 10 % | IN 20 | IN 20 % | Opp Side | Opp Side % | In Own 21 AVG | In Own 21 NAVG |
|---|---|---|---|---|---|---|---|---|---|---|
| Chris Jones | DAL | 66 | 13 | 19.7% | 36 | 54.6% | 20 | 30.3% | 44.4 | 43.3 |
| Jordan Berry | PIT | 64 | 9 | 14.1% | 33 | 51.6% | 15 | 23.4% | 47.4 | 44 |
| Sam Koch | BAL | 84 | 17 | 20.2% | 45 | 53.6% | 18 | 21.4% | 49.5 | 40.5 |
| Ryan Quigley | MIN | 71 | 13 | 18.3% | 33 | 46.5% | 15 | 21.1% | 48.6 | 37.5 |
| Dustin Colquitt | KC | 65 | 7 | 10.8% | 34 | 52.3% | 13 | 20.0% | 48.8 | 46.5 |
| Bryan Anger | TB | 65 | 8 | 12.3% | 25 | 38.5% | 12 | 18.5% | 47.2 | 44.2 |
| Pat O’Donnell | CHI | 87 | 12 | 13.8% | 44 | 50.6% | 16 | 18.4% | 48.6 | 44.2 |
| Drew Kaser | LAC | 74 | 9 | 12.2% | 36 | 48.7% | 13 | 17.6% | 56.1 | 47.3 |
| Brad Nortman | JAX | 87 | 12 | 13.8% | 34 | 39.1% | 15 | 17.2% | 50.4 | 44.3 |
| Ryan Allen | NE | 58 | 8 | 13.8% | 26 | 44.8% | 10 | 17.2% | 47.4 | 44.1 |
| Matt Haack | MIA | 83 | 12 | 14.5% | 36 | 43.4% | 14 | 16.9% | 49.1 | 44.3 |
| Colton Schmidt | BUF | 79 | 12 | 15.2% | 26 | 32.9% | 13 | 16.5% | 48.6 | 43.4 |
| Marquette King | OAK | 69 | 13 | 18.8% | 36 | 52.2% | 11 | 15.9% | 49.2 | 41.9 |
| Tress Way | WAS | 83 | 12 | 14.5% | 36 | 43.4% | 13 | 15.7% | 49.1 | 45.6 |
| Thomas Morstead | NO | 60 | 10 | 16.7% | 33 | 55.0% | 9 | 15.0% | 49.5 | 39.9 |
| Rigoberto Sanchez | IND | 84 | 10 | 11.9% | 27 | 32.1% | 12 | 14.3% | 48.2 | 45.3 |
| Jon Ryan | SEA | 92 | 11 | 12.0% | 37 | 40.2% | 13 | 14.1% | 50.2 | 39.6 |
| Andy Lee | ARI | 88 | 17 | 19.3% | 41 | 46.6% | 12 | 13.6% | 49.1 | 39.7 |
| Donnie Jones | PHI | 67 | 8 | 11.9% | 27 | 40.3% | 9 | 13.4% | 47.9 | 44.7 |
| Brad Wing | NYG | 95 | 8 | 8.4% | 29 | 30.5% | 12 | 12.6% | 46.2 | 39.6 |
| Bradley Pinion | SF | 75 | 5 | 6.7% | 36 | 48.0% | 9 | 12.0% | 46.3 | 43 |
| Michael Palardy | CAR | 71 | 10 | 14.1% | 33 | 46.5% | 8 | 11.3% | 51.1 | 46.2 |
| Matt Bosher | ATL | 53 | 12 | 22.6% | 28 | 52.8% | 6 | 11.3% | 47.9 | 44.4 |
| Johnny Hekker | LA | 65 | 11 | 16.9% | 33 | 50.8% | 7 | 10.8% | 52.4 | 48.2 |
| Kevin Huber | CIN | 88 | 9 | 10.2% | 43 | 48.9% | 9 | 10.2% | 48.4 | 40.2 |
| Britton Colquitt | CLE | 80 | 14 | 17.5% | 37 | 46.3% | 8 | 10.0% | 50.9 | 45 |
| Lac Edwards | NYJ | 94 | 19 | 20.2% | 49 | 52.1% | 9 | 9.6% | 48 | 42.1 |
| Riley Dixon | DEN | 73 | 7 | 9.6% | 28 | 38.4% | 6 | 8.2% | 47.6 | 38.6 |
| Brett Kern | TEN | 75 | 10 | 13.3% | 35 | 46.7% | 6 | 8.0% | 52.9 | 46.8 |
| Shane Lechler | HOU | 92 | 19 | 20.7% | 48 | 52.2% | 7 | 7.6% | 48.1 | 41.4 |
| Justin Vogel | GB | 71 | 3 | 4.2% | 22 | 31.0% | 5 | 7.0% | 47.2 | 42.1 |


