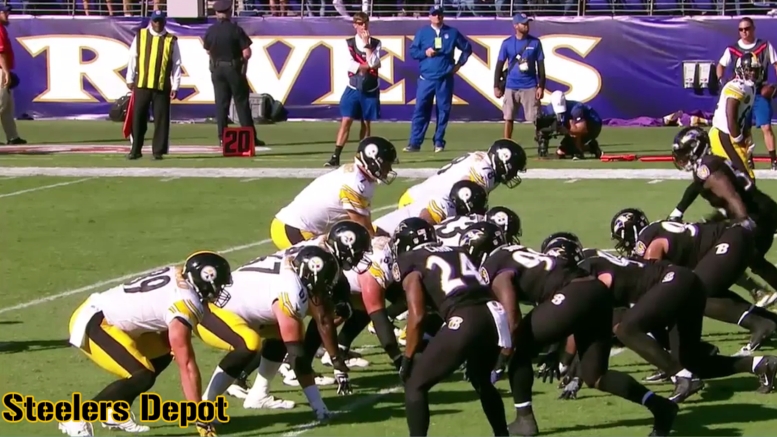
Mike Tomlin and the Pittsburgh Steelers were so dissatisfied out of what they had seen from their tight end group during the offseason, into training camp, and through the early stages of the preseason, that they deemed it necessary to go out and acquire a new, legitimate talent via the trade market.
Not exactly business as usual for the franchise, but when they have felt the need to make a move, and had the resources to make it—and the move made sense—they have done it, from time to time. in this case, the swapping of a fourth-round pick for a fifth-round pick yielded them Vance McDonald and his shiny new contract with accelerating base salaries that can be gotten out of easily on an annual basis.
I thought it would be interesting to reflect on how the tight end group as a whole performed this season, and draw comparisons to recent years, so I put together some charts to make that task an easier one at a glance.
What we see from the data below is that attempts to target the tight end position have resulted in a substantially reduced rate of success based on whether or not the pass is caught during the past two years, following the retirement of Heath Miller. While Jesse James improved from a 65-percent catch rate from last season to over 68 percent this season, Miller provided greater reliability. He also provided a lot more bang for the buck until his final season.
But as a group, they did improve in catch percentage despite seeing about a quarter fewer targets. Vance McDonald, as Ladarius Green did the year before, provided the ‘explosive’ dynamic to the group.
The tight end group gets targeted more when McDonald is healthy. If McDonald is back next year and stays on the field, the group could have a big season, though he also has to work on his catch percentage.
| Tight End Production Over Past Five Seasons | ||||||
|---|---|---|---|---|---|---|
| 2017 | ||||||
| Player | Targets | Catches | % | Yards | YPC | TDs |
| Jesse James | 63 | 43 | 68.3 | 372 | 8.7 | 3 |
| Vance McDonald | 24 | 14 | 58.3 | 188 | 13.4 | 1 |
| Xavier Grimble | 9 | 5 | 55.6 | 32 | 6.4 | 1 |
| Total | 96 | 62 | 64.6 | 592 | 9.5 | 5 |
| 2016 | ||||||
| Player | Targets | Catches | % | Yards | YPC | TDs |
| Jesse James | 60 | 39 | 65 | 338 | 8.7 | 3 |
| Ladarius Green | 34 | 18 | 53 | 304 | 16.9 | 1 |
| Xavier Grimble | 21 | 11 | 52 | 118 | 10.7 | 2 |
| David Johnson | 11 | 7 | 64 | 80 | 11.4 | 0 |
| Total | 126 | 75 | 60 | 840 | 11.2 | 6 |
| 2015 | ||||||
| Player | Targets | Catches | % | Yards | YPC | TDs |
| Heath Miller | 81 | 60 | 74 | 535 | 8.9 | 2 |
| Matt Spaeth | 3 | 2 | 67 | 56 | 28.0 | 0 |
| Jesse James | 11 | 8 | 73 | 10 | 1.3 | 1 |
| Total | 95 | 70 | 74 | 601 | 8.6 | 3 |
| 2014 | ||||||
| Player | Targets | Catches | % | Yards | YPC | TDs |
| Heath Miller | 91 | 66 | 72.5 | 761 | 11.5 | 3 |
| Matt Spaeth | 4 | 3 | 75 | 46 | 15.3 | 1 |
| Michael Palmer | 2 | 1 | 50 | 1 | 1 | 1 |
| Total | 97 | 70 | 72.2 | 808 | 11.5 | 5 |
| 2013 | ||||||
| Player | Targets | Catches | % | Yards | YPC | TDs |
| Heath Miller | 79 | 58 | 73.4 | 593 | 10.2 | 1 |
| Matt Spaeth | 2 | 1 | 50 | 11 | 11.0 | 1 |
| David Paulson | 10 | 6 | 60 | 102 | 17.0 | 0 |
| David Johnson | 6 | 4 | 66.7 | 70 | 17.5 | 0 |
| Michael Palmer | 1 | 1 | 100 | 8 | 8.0 | 0 |
| Total | 98 | 70 | 71.4 | 784 | 11.2 | 2 |


