Every week I will chart Ben Roethlisberger’s completions across a variety of categories in an effort to uncover the strengths and weaknesses of the Pittsburgh Steelers’ passing game. As we get deeper into the season and as more throws get recorded, this information will become more reliable in identifying various trends and tendencies. If there are any other areas related to the passing game that you think are worth monitoring please let me know in the comments.
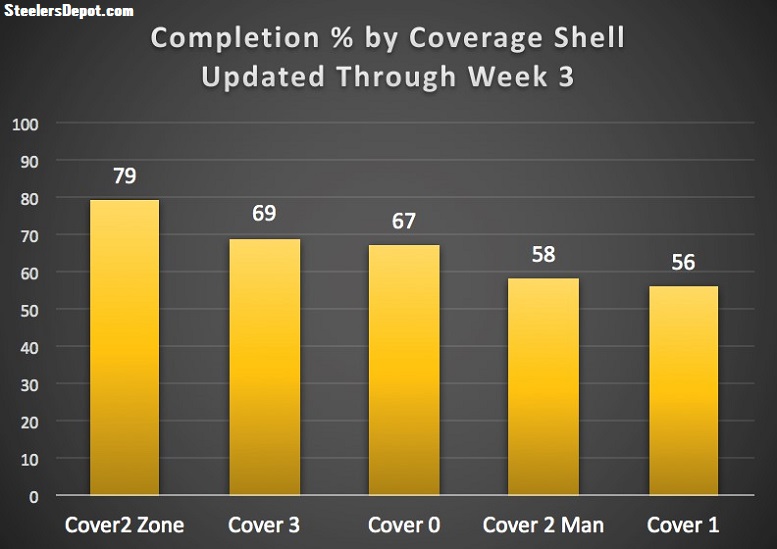
Completion Percentage by Coverage Shell
In last week’s completions report I discussed how Roethlisberger has been noticeably better throwing against Zone than he has against Man coverages. That trend remains after Week 3’s game against the Bears. Through 61 total passing snaps against Man (Cover 0, Cover 1, and Cover 2-Man) Roethlisberger has completed only 57.4% of his passes, compared to 72.9% after playing 48 snaps against Zone (Cover 3 and Cover 2-Zone).
Remember to keep in mind that the types of throws that Roethlisberger attempts against each coverage are very different (he’s more likely to take deep shots against Man and more likely to take underneath routes against Zone) and this likely has a strong effect on his level of success. Also, while I haven’t charted defensive blitz percentages, I would suspect that he has faced more pressure against Man coverage shells, which would likely affect his completion rates as well.
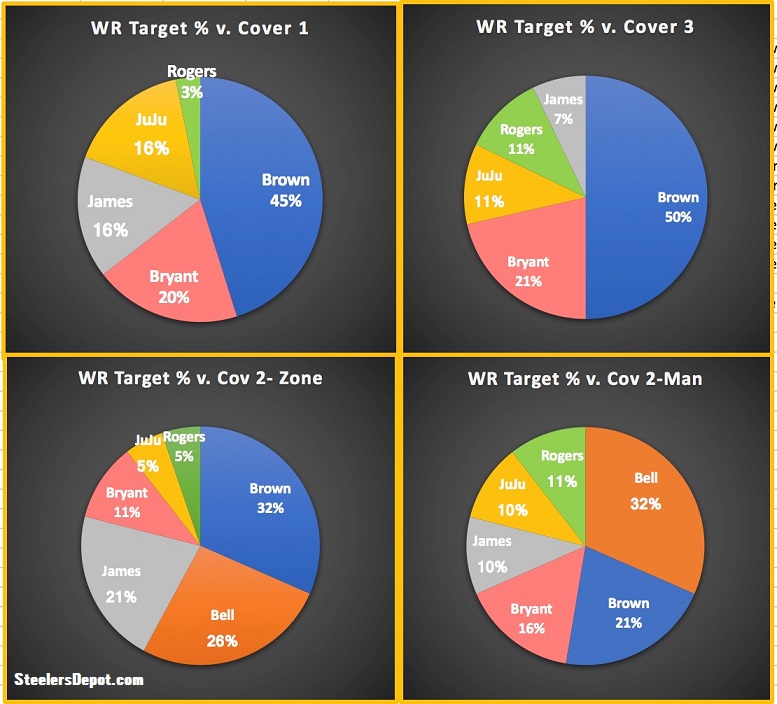
Additionally, I also charted the frequency that Roethlisberger targets each receiver when facing specific coverages. One interesting trend is that Antonio Brown gets the ball thrown his way significantly more often against single-high safety coverages than against two-high safety looks.
Completion Percentage by Route Type
This next chart is fairly straightforward; however, I want to note a few small changes since last week. The completion percentages for Crossers, Screens, Digs, Corners, and Posts all slightly improved, while the percentages for Outs, Slants, Seams, and Verticals decreased. These numbers will become more meaningful as the season goes on and as more data becomes available. Expect to see significant fluctuations in the coming weeks.
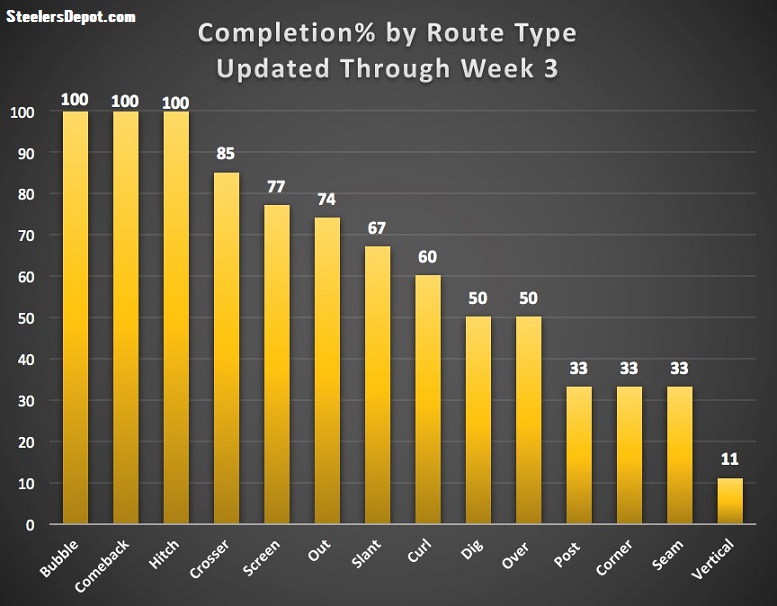
Completions/Attempts per Route: Bubble (5/5), Comeback (1/1), Hitch (9/9), Crosser (11/13), Screen (10/13), Out (14/19), Slant (8/12), Curl (3/5), Dig (2/4), Over (1/2), Post (2/6), Corner (1/3), Seam (3/9), Vertical (1/9)
Completion Percentage by Targeted Receiver
Similar to Roethlisberger’s completion percentages against various Coverage shells, his percentage categorized by his intended receiver is also largely dependent on the types of routes run by each player. For example, LeVeon Bell gets his targets by running routes that have a much higher probably of success than the routes run by Martavis Bryant. Additionally, one positive trend that is worth monitoring is Jesse James’ improvement as a pass catcher. Despite seeing a high volume of contested targets this year, he has still managed to achieve a 71% catch rate, which is a decent increase from last year’s 65%. He has only received 17 total targets thus far and still has a long way to go, but hopefully he can continue this level production throughout the entire season.
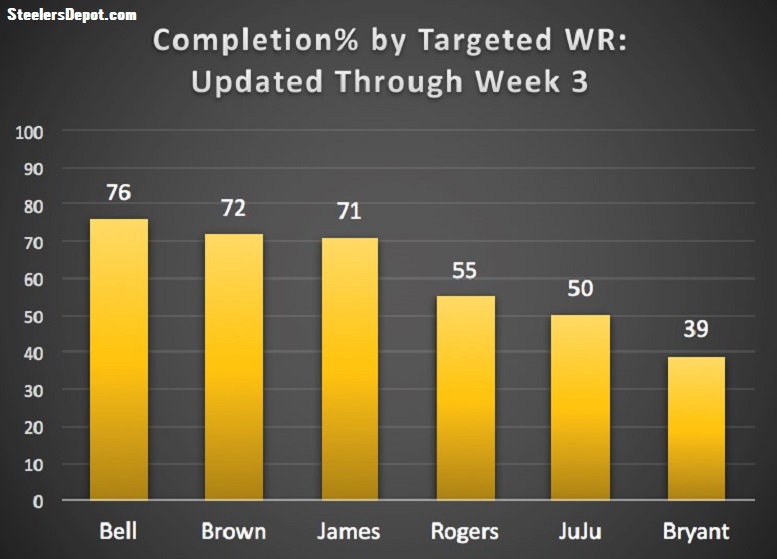
Catches/Targets: Bell (13/17), Brown (26/36), James (12/17), Rogers (6/11), JuJu (5/10), Bryant (7/18)
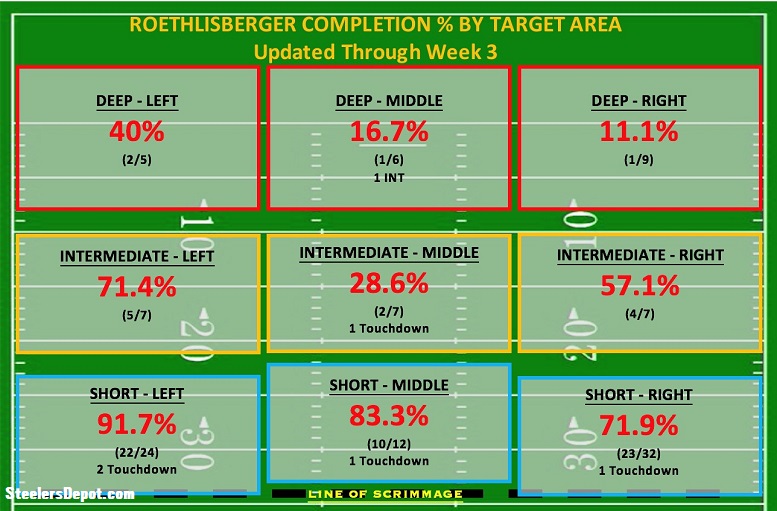
Completion Percentage by Target Area
Roethlisberger’s completion rate in the deeper areas of the field improved slightly compared to last week, while his rate in the intermediate zone decreased. He still has not recorded enough throws for us to draw any meaningful conclusions about his accuracy, so don’t read too much into this chart yet. Once more passes get recorded, I am planning on comparing his completion percentages in his hot areas to his performance against different coverages.
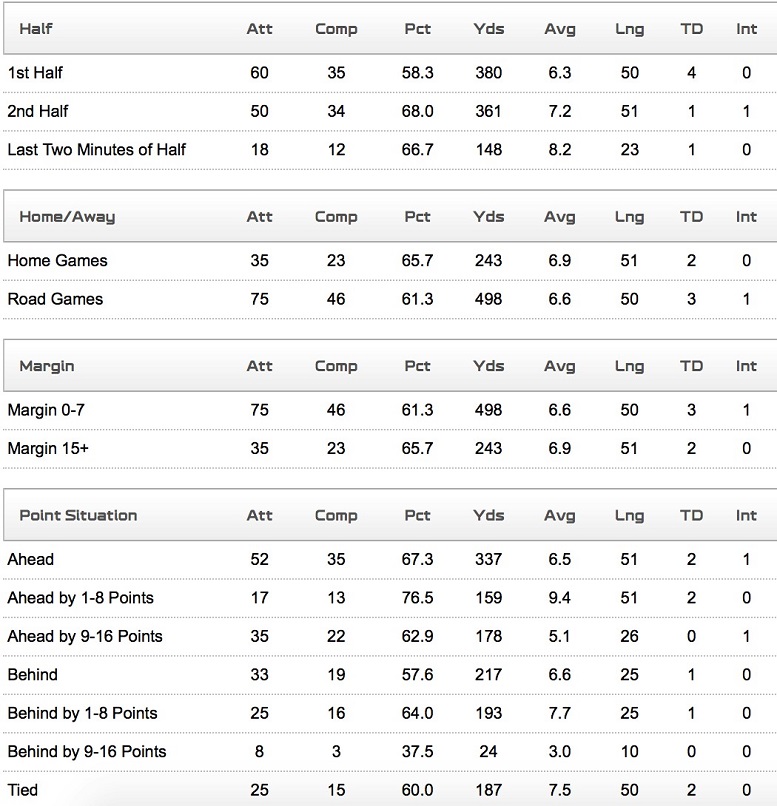
Situational Passing Stats
Lastly, I pulled this chart from NFL.com for those that asked to see some stats relating Roethlisberger’s performance in different game situations: