Sustaining drives is obviously vital to a successful offense. Today, I wanted to evaluate unsuccessful ones, looking at three-and-outs for new Steelers OC Arthur Smith and Pittsburgh since 2019 by season.
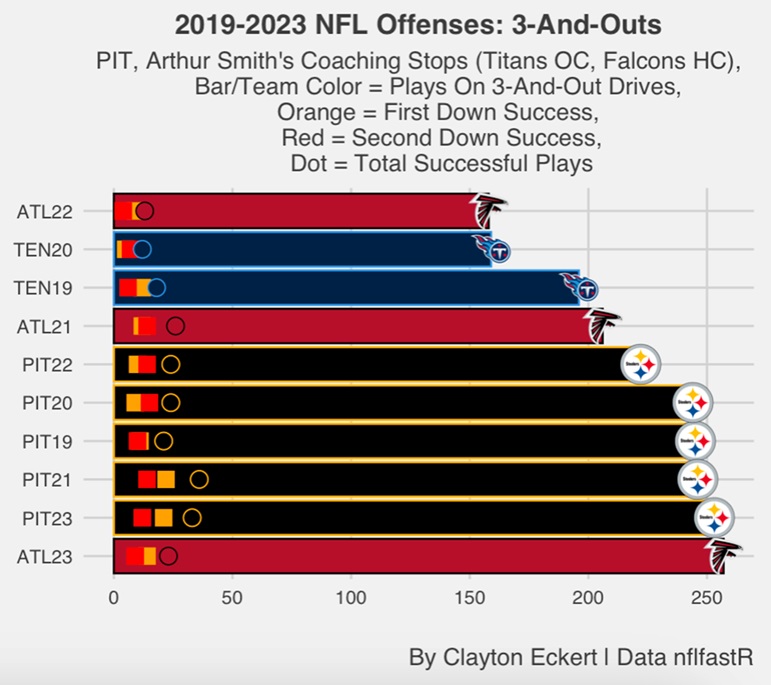
Let’s jump right in. Here is a visual of total plays on three-and-out drives (bar), first down success (orange square = six yards or >= 40-percent of the needed yardage), second down success (red square = six yards or >= 50-percent of the needed yardage), and total successful plays (dot):
Lots of valuable information to unpack. First, we see that four of the five teams that Smith coached had the least three-and-out plays, encouragingly. His team with the fewest three-and-out plays were the 2022 Falcons. They had just 158 plays, which ranked 23rd out of 160 teams in the span. The 2020 Titans had an eerily similar 159 three-and-out plays, landing at the 24th rank.
This was also true for the 2019 Titans and 2021 Falcons, to a lesser degree. Tennessee had 196 three-and-out plays that year, tying for 68th since 2019 (above average), while Atlanta’s 206 tied for 81st (middle of the pack).
Then we have the five Pittsburgh teams, all having a high number of three-and-out plays, discouragingly:
PIT22: 222 three-and-out plays (100th).
PIT20: 244 three-and-out plays (124th).
PIT19: 245 three-and-out plays (125th).
PIT21: 246 three-and-out plays (126th).
PIT23: 253 three-and-out plays (134th).
This gives specific context to the painful three-and-out results the team has had the last five seasons. Consistently below league average, the Steelers desperately need to turn this around in hopes for a more successful 2024 season. Smith having less negative drive stalling plays at the majority of his coaching spots to date brings optimism that this could improve.
Unfortunately though, we see a recent blemish on his resume, with the 2023 Falcons having the most three-and-out plays of the teams we’re focused on. 257 to be exact, which ranked 137th (160 qualifiers), which was four more than the Steelers last season. So, both Smith and Pittsburgh struggled with drives stalling quickly in 2023.
The squares and dots also show more context to what occurred through success rates. Here’s a specific breakdown of successful plays on three-and-out drives for Smith and Pittsburgh, bolding which down saw more of it:
TEN19: 18 total successful plays, 12 first down success, six second down success.
TEN20: 12 total successful plays, five first down success, seven second down success.
ATL21: 26 total successful plays, 12 first down success, 14 second down success.
ATL22: 13 total successful plays, nine first down success, four second down success.
ATL23: 23 total successful plays, 14 first down success, nine second down success.
PIT19: 21 total successful plays, 11 first down success, ten second down success.
PIT20: 24 total successful plays, nine first down success, 15 second down success.
PIT21: 36 total successful plays, 22 first down success, 14 second down success.
PIT22: 24 total successful plays, ten first down success, 14 second down success.
PIT23: 33 total successful plays, 21 first down success, 12 second down success.
Keeping in mind that the 2022 Falcons limited three-and-out drives the most of the focused-on teams, they did so by having more successful plays on first down. The 2020 Titans had similar success limiting three-and-outs, but had more success on second downs in the situation. Largely, first downs were a bit more successful for focused teams (six-of-ten), meaning less success on second downs were a bigger cause of three-and-out drives as one might expect.
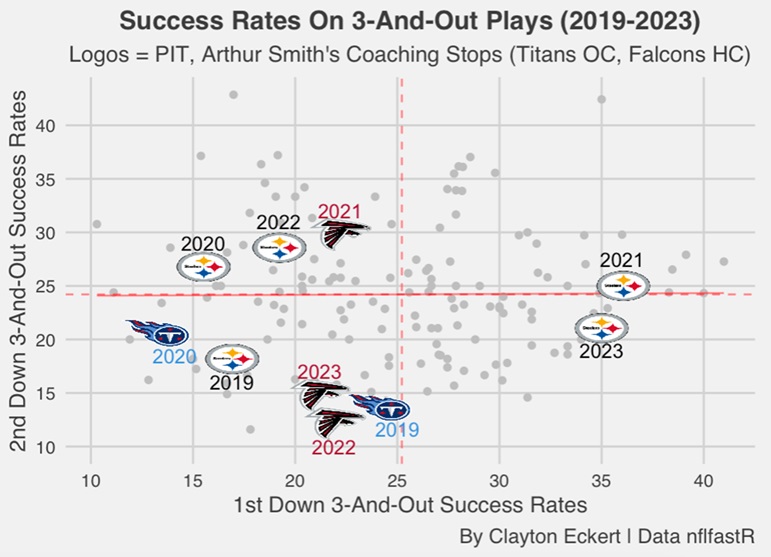
Looking league-wide, there wasn’t a correlation to that though, which we’ll see clearer in this visual of first and second down success rates:
As I just alluded to, the gray dots (league results) being all over the map on the scatter plot emphasizes that first or second downs didn’t lead to the drive ultimately stalling overall. For Pittsburgh though, the 2021 and 2023 Steelers were quite successful on first downs but were unable to sustain thereafter (particularly in 2023), while the 2020 and 2022 teams were better on second down and faced three-and-outs less.
Smith’s units did face the situation less overall, but when they did, were below average on both downs four of the five seasons. 2021 was the only exception, where Atlanta was stronger on second down and faced the situation least among focused teams.
So, for Pittsburgh and Smith, the teams that limited three-and-outs the most were more successful on second down, which makes sense. In turn, first down success didn’t amount to much, where the 2021 and 2023 Steelers were successful but had among the highest three-and-out drives in that timeframe.
Ultimately, you don’t want to be in the situation, so the teams with fewer three-and-out plays is the biggest stat to glean from the study. Encouragingly, Smith has provided that much more than Pittsburgh the last five years, and hopefully brought that with him for 2024 improvements for the black and gold.
Thanks for reading and let me know your thoughts in the comments.

