Today, I wanted to provide some valuable team metrics for 2023 to date, and by the end of the article use a cumulative format I came up with last summer to summarize how teams fared, along with takeaways for the Steelers season. The three main stats used are Adjusted Net Yards per Pass Attempt (ANY/A), Turnovers and Explosive Plays (TOX), Successful Run Rates, and the total calculations called CATS for short.
First, let’s look at ANY/A which is defined as (Passing Yards – Sack Yards + (20* Passing TD) – 45 * Interceptions)) / (Passes Attempted + Times Sacked). Using the differential for offenses (OANY/A) and defenses (DANY/A), this is the most predictive individual stat in predicting Super Bowl Winners that I have found in my studies:
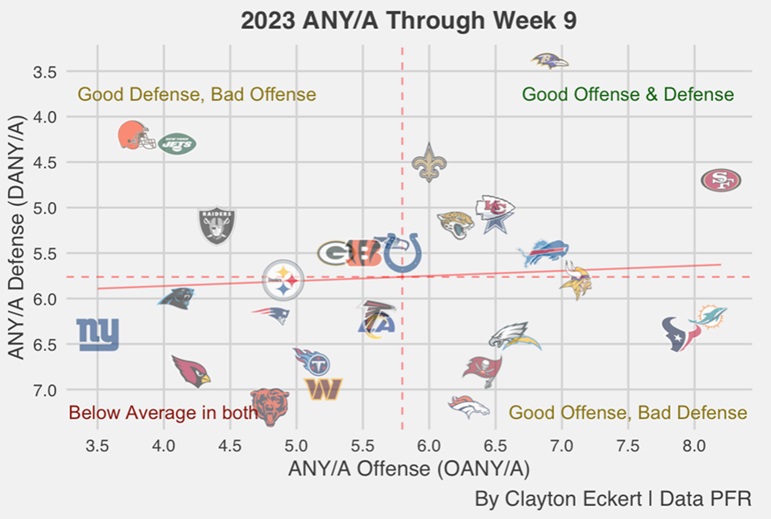
Pittsburgh’s offense has a 4.9 OANY/A that ranks 24th, which is well below an ideal baseline in the sixes (where we see several stronger passing offenses). Optimistically, QB Kenny Pickett has had a six-plus OANY/A in three of his last four appearances. In the first four games of the season, Pickett had particularly poor numbers in blowout losses: week one against the 49ers (2.5) and Houston in week four (1.9). His best number came was the week three win in Las Vegas (9.2). The defense has a 5.8 DANY/A that ties for 16th, in the middle of the pack, and just under the ideal number of six.
As we can see from the visual, the offense is where the biggest improvement needs to be made, but seeing better results in the last four games (6.1 OANY/A) is encouraging moving forward.
In terms of differential, the Steelers have a -0.9 ANY/A, which ties for 24th. Only one team has achieved the ultimate goal of winning a Super Bowl since 2000 with a negative differential. Eight teams land comfortably above the mean on both sides of the ball: Baltimore (best defense), San Francisco (best offense), Kansas City, New Orleans, Buffalo, Dallas, Detroit, and Jacksonville. Each has winning records, along with several at the top of their division. Pittsburgh has faced three of these teams, with a 1-2 record, with the crucial win tally against the division rival Ravens.
Next, let’s look at turnover and takeaways:
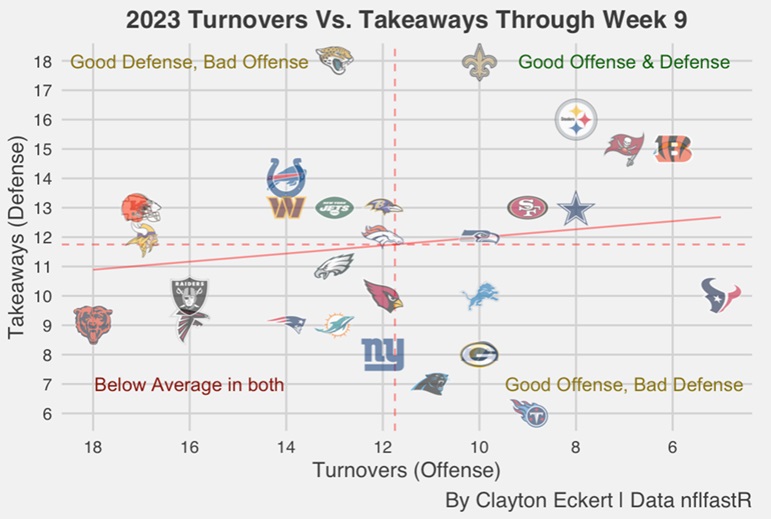
The Steelers are tied for fifth best in turnovers with eight and rank third in takeaways with 16. This gives Pittsburgh a plus-eight turnover differential, which impressively ties for second-best in the NFL. Seven teams are comfortably above the mean on both sides of the ball: the Chargers, AFC North Bengals and Steelers, Saints (T-best defense), Buccaneers, Cowboys, and 49ers.
Houston has the best result on offense with only five turnovers, and the Jaguars tie for the most takeaways with 18. Both teams handed Pittsburgh losses, with those units being huge factors in those games.
Pickett and the Steelers’ offense have taken care of the football, and the defense creating splash plays with takeaways has been the main reason this team is luckily 5-3.
Now, here are the explosive play results (passing and rushing plays of 20+ yards) for NFL offenses and defenses:
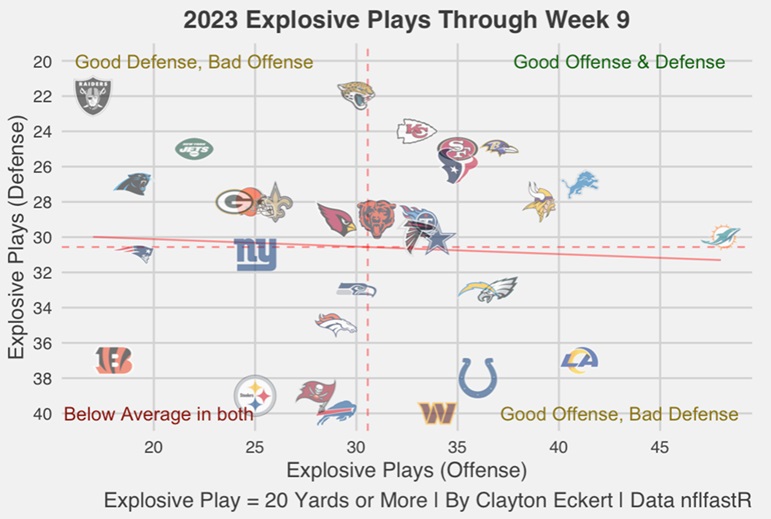
The Steelers’ biggest weakness on both sides of the ball has been explosive plays, well below the league mean in each. This is the main flaw of Pittsburgh’s defense in 2023, allowing 39 explosive plays which ties for a painful 29th rank. The data gives comparative context to their boom-bust nature, creating splash plays at one of the highest rates, but allowing them at one of the worst.
The offense is also lacking in this department, with 25 explosive plays (T-24th). This element of the game has become very important in today’s NFL, particularly on defense with the last seven Super Bowl winners above average in explosive plays allowed. Unfortunately for Pittsburgh, their numbers equate to the second-worst -14 explosive play differential through week nine (besting only the Bengals within the division). Ouch.
Here are the successful run rates, defined as six yards or 40% of the needed yardage on first down, six yards or 50% of the needed yardage on second down, and third or fourth downs gaining the needed yardage for a first down or a touchdown:
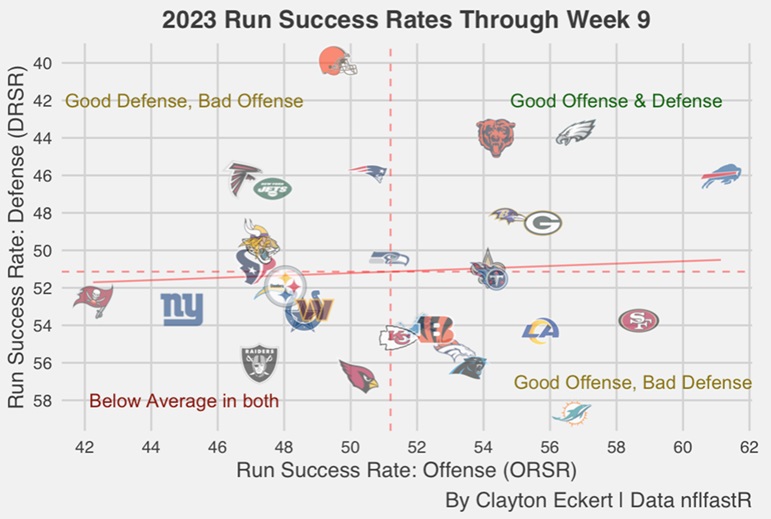
Pittsburgh ranks 23rd in run success rate on offense (48 percent), while the defense has allowed a 51.9 run success rate (16th). Once again, we see the offense has been the weaker side of the ball for Pittsburgh. They started the season particularly slow, with encouraging positive trends recently, including the most rush yards of 2023 in week nine (166) and four touchdowns in the last three games (none in the first five).
The Steelers’ defense has allowed 100-plus rushing yards in all but one game this season, with the exception being the Raiders back in week three (69 yards), along with tying for the fifth-most yards per attempt this season (4.5). DL Cameron Heyward returned in week nine (55.4 snap percentage), and his strengths in run defense will hopefully be a boost as he gets more snaps after missing seven games.
Pittsburgh has a run success rate differential of -3.9, which ranks a lowly 28th in the NFL. Just five teams are above the mean in both: Buffalo, Philadelphia, Chicago, Baltimore, and Green Bay. The latter is the next challenge on Pittsburgh’s schedule, and it will be interesting to see how the run games fare on both sides of the ball.
So, the lone strength in comparison to the rest of the NFL on offense is a low turnover total (T-fifth). Well below average otherwise, with a 23rd rank in run success rate, 24th in ANY/A, and explosive plays (T-24th). We are seeing improvements, particularly in the run game and ANY/A, encouragingly. Explosive plays have not, with only four in the last two games since the bye.
In that span, the defense has allowed a whopping 14 explosive plays, contributing to their lowest season rank of 2023 (29th). This is by far their biggest flaw to date, compared to an impressive third rank in takeaways, and middling 16th ranks in DANY/A and run success rates.
Very telling data and useful information around the league. Taking all this into account, Pittsburgh lands 24th in CATS, with negative differentials in each of the final data points below. Several key areas to hopefully improve on moving forward, and knock on wood that’s the case through the remainder of 2023.
Here’s the summary table of the stats used today, showing the differential numbers of teams’ offenses and defenses along with their ranks, and sorted by CATS differential:
![]()
Thanks for reading and let me know your thoughts in the comments.


