Today I wanted to look at and provide data on explosive plays (20+ yards) for the last decade across the NFL, with the goal of seeing how it correlates to team success, viewing trends for Pittsburgh and the era as a whole, and takeaways moving forward.
Let’s jump right in. First, I wanted to chart offensive and defensive explosive plays, accounting for all of the 320 in the era, but viewing only Super Bowl winners and the Steelers for a cleaner graph, to see how they stacked up:
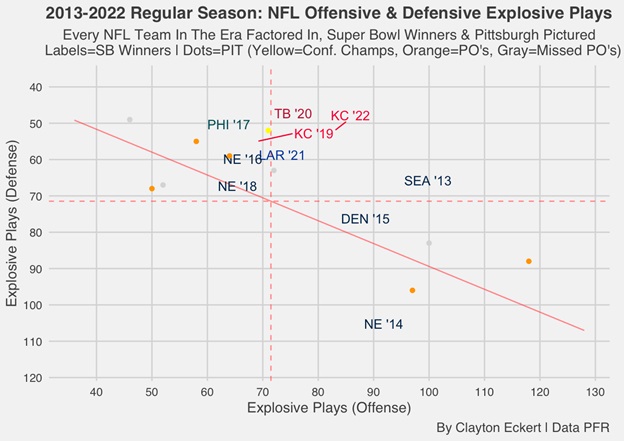
There’s a lot of great info to unpack here, and what jumps out right away to me is that no Super Bowl champion in the era landed below the mean in both data points. This is also a feat Pittsburgh was able to achieve each season, with the highlight as conference champions in 2016, and five playoff appearances as well. This is good for a 60% playoff rate the last 10 years, which ranked fifth in the era, bested by the Chiefs at a whopping 90%, the Patriots and Seahawks at 80%, and the Packers at 70%. The Steelers’ number has been stronger on defense over the years as expected, with above average results in seven of the 10 seasons, and four of those making the postseason (including the conference championship). Pittsburgh’s three above the mean seasons on offense ranked encouragingly high compared to Super Bowl winners (first, third, and fourth), picking up the slack for its defenses allowing more explosive plays.
Circling back to the Super Bowl winners, we see a trend through the era. From 2013-2015, offensive results got you the Lombardi (with Seattle’s 2013 “Legion of Boom” defense of course strong as well), then a shift to defenses limiting explosive plays from 2016-2018, and very notably from 2019-2022 teams were above the mean in both, with nice balanced numbers. This is very interesting information about how things have trended over the years, and how teams have achieved hoisting the Lombardi Trophy more recently. Let’s examine the data further to see how it stacks up with the NFL in each facet.
Here’s the offensive explosive play results:
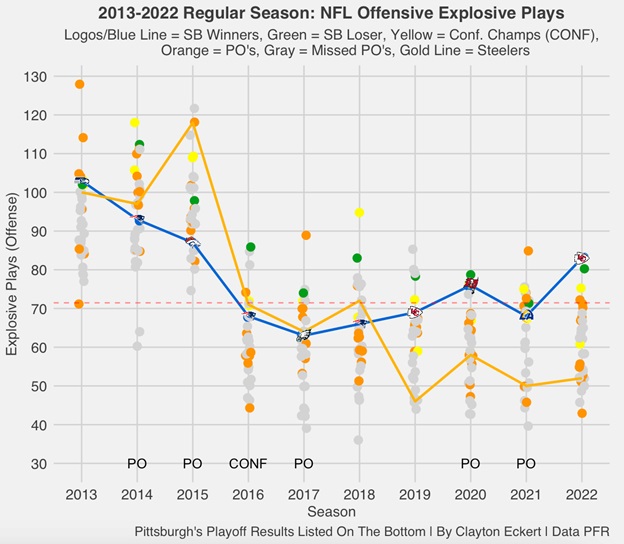
Overall, we the offensive trend I alluded to earlier was not limited to Super Bowl winners and the Steelers, with the vast majority of teams landing above the mean from 2013-2015 (96.9%!), which was definitely higher than I expected, with every playoff team above average in 2014 (including Pittsburgh), and all NFL teams achieving this in 2015. Then we see a downtrend from 2016-2022, with defenses adjusting and accounting for this element of the game overall. Interestingly, only 28.6% of Super Bowl winners were above the mean in this era, compared to 100% of the Super Bowl losers at or above average. So, each Super Bowl winner had more than 60 explosive plays on offense, a feat that Pittsburgh did not achieve in the last four seasons.
Pittsburgh’s offensive results interestingly were close to Super Bowl winners from 2013-2018 when four of six playoff appearances occurred, and the 2015 season being the positive exception, when they tied for third best over the entire decade! In 2016, the Steelers were right at league average when they won the conference championship, just above the Super Bowl winners in the Patriots. From 2019-2022 was a different story though, well below league average on offense and only two playoff appearances, while the Super Bowl winners (and playoff teams) have trended upward overall. This paints the important comparative context we’re all aware of: the Pittsburgh Steelers have to get more explosive plays on offense to return to their winning ways and get number seven for the trophy case, with 60 being the minimum target from what we’ve learned today.
Now for the defensive results:
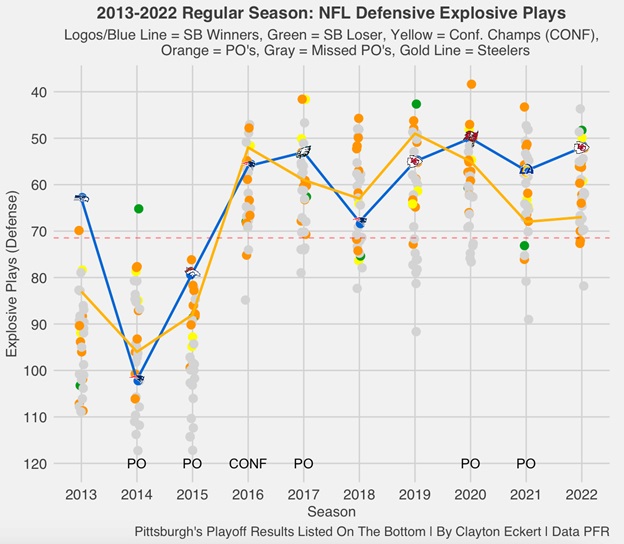
Here we see the flip side of the results, with defenses struggling to limit explosive plays from 2013-2015. The three teams that landed above the mean in this era were the 2013-15 Seahawks, who won the Super Bowl, played in another, and made the playoffs, emphasizing how rare and valuable that was to making the postseason. The 2014-2015 seasons were the rare and only years when Super Bowl-winning defenses were below average in allowing explosive plays, along with a whopping 98.4% of playoff teams (all but one squad). Then from 2016-2022, defenses were largely above the mean in limiting explosive plays, including every Super Bowl winner. We can also see the vast majority of playoff teams were above average as well, with every playoff team achieving this in 2017 and 2020, and all but five postseason teams from 2019-2022 at or below average (96.1%).
Pittsburgh largely followed the Super Bowl winners by season, with the exceptions being well below the 2013 Seattle defense (as the whole league was) and, unfortunately most recently, particularly the last two seasons, with their worst results since 2015 though still above league average. So, a downtrend in recent seasons for the Steelers on defense as well, though not to the extreme of the offensive results. Obviously, it would be ideal for the numbers to improve on both sides of the ball, but obviously the Pittsburgh offense has to be the one to step up. So, the ideal number for defenses to be under for explosive plays, in my opinion, is 70, which every Super Bowl winner has done since 2016 (as well as Pittsburgh), with the exceptions being earlier in the era and not as notable in today’s game.
Now let’s put the puzzle pieces together, and look at the explosive play differentials (offensive – defensive explosive plays):
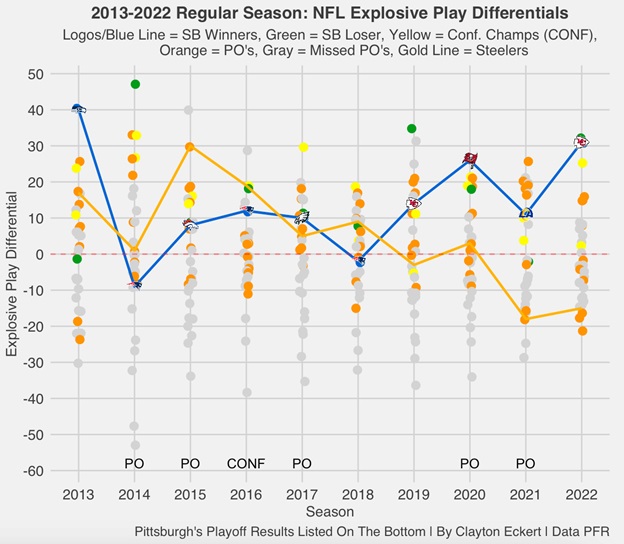
Very telling information. Starting with the Super Bowl winners, we see that 80% of them had a positive differential, with the NFL mean ironically landing right at zero. The strongest Super Bowl-winning differential was the 2013 Seahawks (40), and the top-ranked team was also Seattle in 2014, when it lost the Super Bowl to the Patriots. New England was interestingly the only team with a negative differential to hoist the Lombardi (twice), though it did not stray too far away. The last four Super Bowl winners ranked second through fifth, highlighting an improvement in terms of the stat that aided their success, with each having a number of 10 or better. You definitely want a positive differential (unless you’re the Patriots) if you want to add hardware to your trophy case. That is discouraging when viewed through Steelers’ lenses considering their negative differential three of the last four seasons, and particularly poor results the last two years. We also get more context to how lucky the Steelers were to make the playoffs in 2021, with the lowest -18 differential of all postseason teams that season (30th overall), and not much better last year (-15 differential, 29th) when their luck fell just short and missed the playoffs.
Undoubtably, the Steelers must improve the most on offense, needing to up their 52 explosive offensive plays from last season to at least 60 (every Super Bowl winner achieved), with 70 or more obviously being ideal considering it being the league average over the last decade. Pittsburgh’s defensive number of 67 last season could also stand to improve, with 70 being the ideal number that every Super Bowl winner (and the Steelers) has achieved since 2016 (when Pittsburgh won the conference championship) but have been on a down trend the last two years. Pittsburgh’s differentials have also declined the last four years, particularly from poor offensive numbers and the downtrend on defense, with their only negative differentials coming three of the last four years, which obviously correlates with less playoff appearances and success. Here’s to hoping the Pittsburgh Steelers can get back on the positive side of the differentials sooner rather than later, considering the high relationship to winning.
What are your thoughts on the data? Thanks for reading and let me know your thoughts in the comments.