The Pittsburgh Steelers had an eventful first day of free agency, with the quick departure of cornerback Cameron Sutton, and wasting no time to sign cornerback Patrick Peterson. Today I wanted to provide some data context to what Peterson provided for the Minnesota Vikings last season, along with 2022 Steelers cornerbacks with substantial targets (30 or more) to get a gauge of the loss/gains from a stats perspective. Let’s get right to it, starting with 2022 coverage snaps and targets for quantity value:
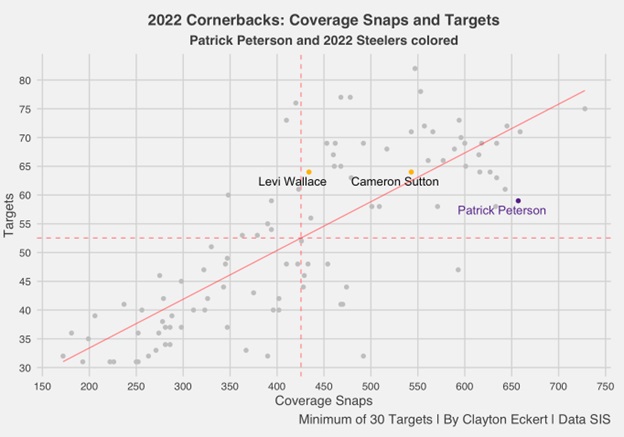
All three qualifying players landed above the mean in opportunities, with Peterson having the most coverage snaps (657), which was third most out of the 101 cornerbacks on the chart. He was targeted 59 times which tied for 39th, encouragingly emphasizing quarterbacks decision to go elsewhere with the football overall. Sutton’s 543 coverage snaps tied for 26th, and was targeted 64 times (near the trendline) which tied for 30th with three other players including Steelers cornerback Levi Wallace, a high rate for the latter who was just above the mean with 434 coverage snaps (56th). Important context as we continue with the data.
Now let’s begin to examine the quality of play with completion percentage and deserved catch percentage, which is the number of completions and drops divided by the number of catchable targets and passes defensed:
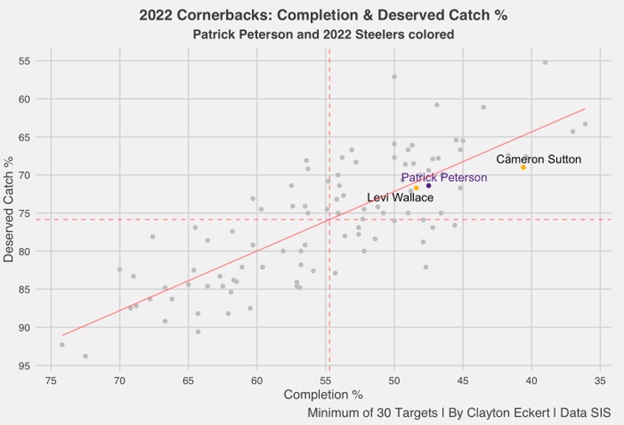
Again, all three players land above the mean in both datapoints. Sutton tops the group with a 40.6 completion percentage allowed which impressively ranked fifth, along with a deserved catch percentage of 69% that ranked 24th. Peterson lands second, with a 47.5 completion percentage allowed that tied for 19th, and a 71.4 deserved catch percentage (T-32nd), which landed closer to Wallace in the results, who had a 48.4 completion percentage allowed (25th) and 71.7 deserved catch percentage that tied for 35th.
Of course, the type of coverage schemes the players were in is an important piece of the puzzle as well, so here are man versus zone percentages from PFF:
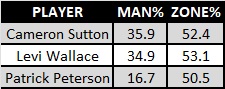
Right away we see the big disparity in man coverage numbers, with Peterson’s 16.7% which was 12th least of the 101 players. The bright side is having above average completion results considering more time spent in zone, which generally gives receivers more separation on their catch opportunities. The flip side is the recency of Pittsburgh playing more man, with Sutton playing nearly 20% more man than Peterson last season, and how the latter will fare if that continues.
Next, let’s look at the depth of targets with yards per attempt and yards per coverage snap:
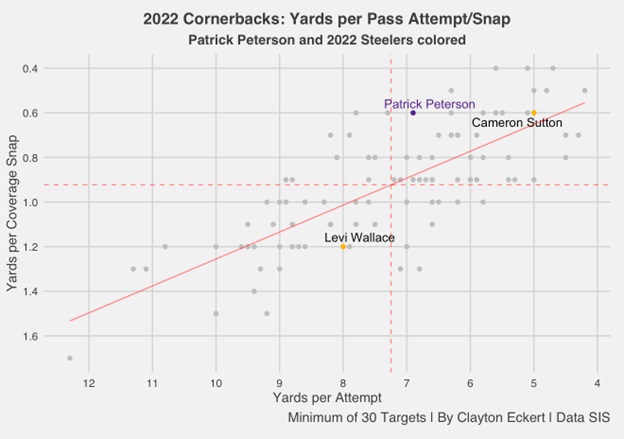
Sutton once again fares best, allowing five yards per attempt which tied for seventh best, along with a 0.6 yards per coverage snap number which tied for eighth. One of these players was Peterson who also landed above the mean in both data points as well, allowing 6.9 yards per attempt which tied for a noticeably lower 48th rank. Alignments are very important to take into account as well, with Peterson playing over 1,000 snaps out wide with only seven in the slot, compared to Sutton who had 650+ out wide and over 150 in the slot. Important context considering outside receivers generally run deeper routes overall. Wallace was below the mean in both, allowing eight yards per attempt (T-68th) and 1.2 per coverage snap which tied for 11th most.
Another stat that is used often to evaluate defenders in coverage is QB Rating Against, so let’s see how they fare along with Wins Above Replacement (WAR), which is a points above replacement scale conversion that is based on the scoring environment:
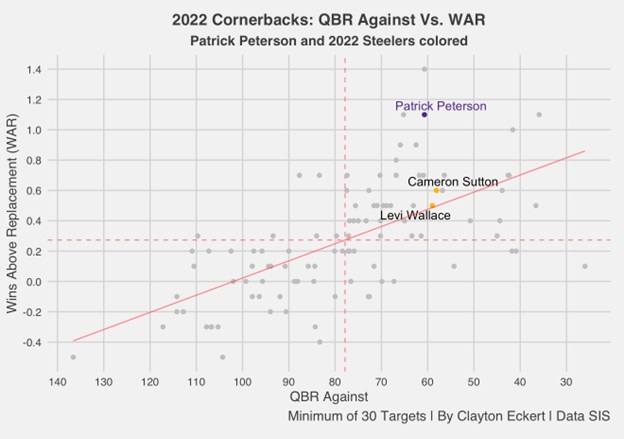
All three land above the mean once again, with Peterson faring very well with a 1.1 WAR that tied for second, compared to Sutton’s 0.6 (19th) and Wallace at 0.5 (T-24th). The QBR Against results were eerily similar, with Sutton’s 58.1 ranking 16th, Wallace landing at the following rank at 59.0, and Peterson at 19th with a 60.7.
To close, let’s look at boom and bust percentages from SIS to see how the cornerbacks performed on extreme end of the spectrum plays:
- Boom % = The percentage of dropbacks that resulted in an Expected Points Added (EPA) of 1 or more (a very successful play for the offense)
- Bust % = The percentage of dropbacks that resulted in an EPA of -1 or less (a very unsuccessful play for the offense)
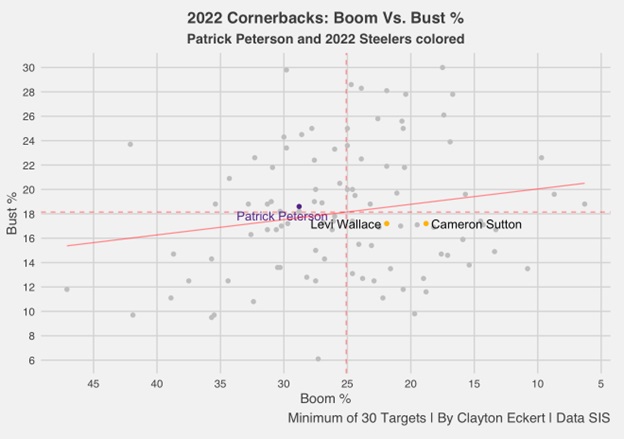
Here we see more varied results, with none of the players in our sites landing above the mean in both datapoints. Sutton had the best result with an 18.8 boom percentage that tied for 20th, and was just below the mean with a 17.2 bust percentage (T-53rd). Wallace was also above the mean in boom percentage at 21.9% which tied for 33rd and tied Sutton in bust percentage. Peterson landed below the mean in boom percentage (28.8%) that tied for a low 71st rank, but was just above average in bust percentage (18.6%) that tied for 45th.
In regards to the data and outlook for 2023, Peterson fared best in coverage snaps (third most) and targeted at a lower than expected rate given the volume primarily as an outside corner (1,000+ snaps) last season. He also tied for second in WAR, and was also well above league average in completion and deserved catch percentages, yards per attempt and coverage snap, and QBR Against. Peterson was slightly above the mean in bust percentage, with the only below average results being boom percentage and lack of time spent in man coverage or in the slot last year. Sutton was well above the mean in every aspect except bust percentage, which was slightly below league average, highlighting the strong 2022 season he just came off and the void Pittsburgh will be looking to fill. Peterson is addition #1, and in comparison had better marks in snaps, yards per coverage snap, WAR, and bust percentage, while Sutton was targeted more, and had better completion rates allowed, yards per attempt, QBR Against, and boom percentage. Wallace fared well in several aspects, above average in snaps, targets, catch percentages, QBR Against, WAR, and boom %, was slightly above average in snaps, just below average in bust percentage, but well below the NFL mean in yardage allowed.
There are no doubt many questions that will have to wait for answers, like what the defense will look like without Sutton’s versatility, how Peterson will perform in the black and gold, if Wallace will be leaned on more in 2023, and what other addition(s) Pittsburgh makes and if it (hopefully) includes a high draft pick to fill out the position room.
What are your thought on the data and the position group for the 2023 season? Thanks for reading and let me know your thoughts in the comments.