Today I wanted to look at some run defense numbers for defensive lineman in the upcoming 2023 NFL Draft. Couple notes before we dive in. First, the players we view today were invited to the combine, and/or the Senior or Shrine Bowl games. Second, the player needed a minimum of 100 total snaps to make the list for today. Also, there may be disagreements/names missing depending on personal opinions, and my list took size and/or substantial snaps played at the position in their final college season in 2022.
With those things in mind, let’s dive in starting with rush snaps and total snaps to get a gauge of the players opportunities and how often they were able to stay on the field for their squads last season:
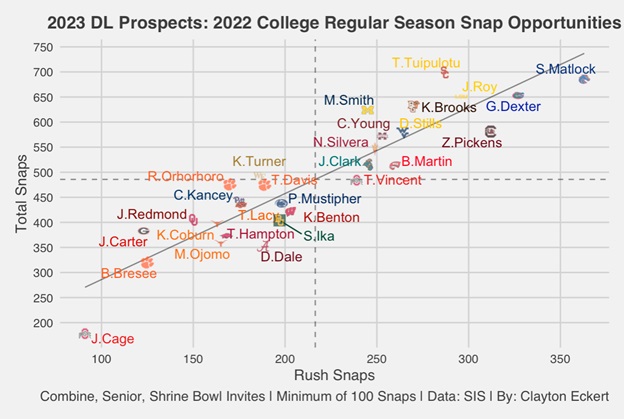
Boise State’s Scott Matlock had the most opportunity in the run game, with 363 rush snaps out of his 686 total snaps last season. For comparisons sake, USC’s Tuli Tuipulotu led the pack in total snaps with 699, but had 287 rush snaps (41.1%) compared to Matlock’s 52.9%. Florida defensive lineman Gervon Dexter had the second most rush snaps, which accounted for 50.1% of his opportunities. The third rank in rush snaps was South Carolina’s Zacch Pickens, the final player to eclipse 300 in the run game which accounted for 53.7% (highest rate of this group) of his opportunities.
There are plenty of other prospects that land on the top right, providing great availability for their teams in the run game and in total snaps. This group includes LSU’s Jaquelin Roy (45.5% rush snaps), Bowling Green’s Karl Brooks (42.8), West Virginia’s Dante Stills (45.7%), Western Kentucky’s Brodric Martin (50.7), Mississippi State’s Cameron Young (44.2), Arizona State’s Nesta Jade Silvera (45.6), Michigan’s Mazi Smith (39.3), and Coastal Carolina’s Jerrod Clark (47.6). Listing their rush snap rates in parentheses gives us a great context to their total snaps numbers as we begin to look at the quality aspects of play.
Next, let’s look at a very important aspect of being a quality run defender, tackling. The chart below looks at the players tackles per game and average tackle depth, with the latter suggesting quality play up front and attacking the line of scrimmage:
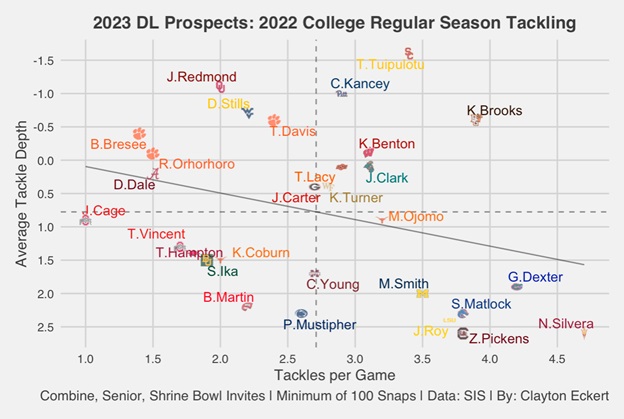
Brooks had the best balance of both data points in 2022, with 3.9 tackles per game (third) along with an average tackle depth of -0.6 that tied for fifth best out of the 29 players in the study. His results are impressive considering most players with that high of a tackle rate allowed more yardage on average. Tuipulotu is next in terms of tackles per game out of the players on the top right at 3.4 (eighth) and had the top rank with an average tackle depth of -1.6. Clark also fared well in this group, especially considering his above the mean opportunities with 3.1 tackles per game and an average tackle depth of 0.1 that each tied for 10th best.
Wisconsin defensive lineman Keeanu Benton tied Clark in tackles per game (3.1) and had a more impressive average tackle depth of -0.1 that tied for eighth, but was just below the mean in opportunities amongst the group. Wake Forest’s Kobie Turner was also below average in rush snaps, but landed on the top right here with 2.8 tackles per game (14th) and an average tackle depth of 0.4 that tied for 13th.
Oklahoma State defensive lineman Tyler Lacy had 2.9 tackles per game (T-12th) along with a 0.1 average tackle depth that tied with Clark at tenth. Pittsburgh’s Calijah Kancey may not fit the size profile for the Steelers liking, but his impressive -1 average tackle depth (third) along with an above average 2.9 tackles per game that tied with Lacy may alleviate those concerns for some, and it will be interesting to see what his combine numbers look like.
This next view attempts to weigh positive and negative plays, using broken and missed tackle rates (negative plays) along with Sports Info Solutions positive play % which is the rate of run plays with the player on the field resulted in a positive expected points added (EPA), with lower percentages being the best:
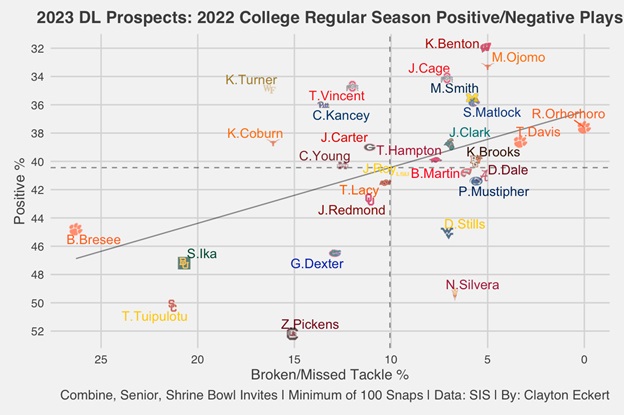
Right away we can see Benton had a substantial impact for his team when on the field on run plays, with an impressive 32% positive percentage along with a strong broken/missed tackle rate of 5.1% that ranked fourth best. Clemson’s Ruke Orhorhoro notably had no broken/missed tackles to his name on his below the mean opportunities, pairing this with a 37.6% positive rate that was ninth best.
Brooks and Clark land above the mean in both data points again, with the former tying for the sixth best broken/missed tackle rate (5.6%) and a 40% positive rate that ranked 15th. The latter had a 7% broken/missed tackle rate (12th) but a slightly better 38.8% positive rate that ranked 12th. Matlock returns to the top right on this chart, with a 5.7% broken/missed tackle rate (eighth) along with a seventh ranked positive rate of 35.8%. Smith also fits this bill with a 5.8% broken/missed tackle rate (ninth) along with a 35.5% positive rate that ranked sixth best.
Some new names at the top right of the chart include Moro Ojomo (Texas), Jerron Cage (Ohio State), Tyler Davis (Clemson), and Terry Hampton (Arkansas), each with broken/missed tackle rates below 10% and less than 40% EPA allowed when on the field for running plays on average.
To close, here is a more total view of the players in the run game using points saved per play (The total of a player’s EPA responsibility on run plays using the Total Points system that distributes credit among all players on the field for a given play (with positive numbers being good). Totals are scaled up to map to the average points scored or allowed on a team level, with the player’s snap count determining how much to adjust. For run defense, that includes accounting for defenders in the box, blown blocks forced, broken tackles, turnovers, and turnover returns.) and points above average per play (using the same Total Points system and putting a number to their value above an average level player):

Georgia’s highly touted prospect Jalen Carter “breaks” this chart, but lands on the top right for the first time of this study. This highlights some lower results in the earlier data including only 123 rush snaps which was second least of the group and only 32.1% of his opportunities. He was also below average with a 11.1% broken/missed tackle rate, though he was at the mean in tackles per game along with an above the mean average tackle depth and positive percentage. Ojomo had the second rank in this view, which also came on a lower 165 run snaps (sixth least) and 46.1% of his opportunities. He was also comfortably above average in tackles per game along with broken/missed tackle and positive percentages, but was slightly below the mean in average tackle depth. Looking forward to seeing his combine workout. Smith also fared very well here, separating himself from the above with more snaps and tackles per game, and also had strong marks in broken/missed tackle and positive rates, with his only below the mean result in average tackle depth.
After a drop off, the remaining players above the mean include Turner, Benton, Penn State’s PJ Mustipher, Brooks, Oklahoma’s Jalen Redmond, and Orhorhoro. Brooks was the only player above the mean in every aspect of today’s study, while Benton only missed out on snap opportunities.
So in my opinion, the data really points to Brooks, Benton, and Smith as the very short list of defensive lineman I hope the Steelers set their sites on, with the longer list including Turner, Matlock, Mustipher, Orhorhoro, and Ojomo as an honorable mention with size/fit in Pittsburgh perhaps being a deterrent. While it’s still early in the process, I hope you enjoyed the information and learned something new about the prospects.
What are your thoughts on the study and the prospects? Thanks for reading and let me know your thoughts in the comments!


