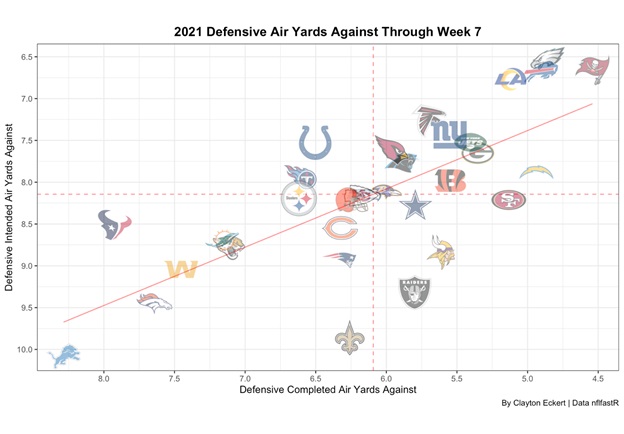
The Pittsburgh Steelers are coming out of their bye week and wanted to take this opportunity to look at something a bit different to start the data points off today. If you have been following Steelers Depot for long, you know about our belief and tracking of air yards stats. Today I wanted to use the following data points that many track for quarterbacks, but reverse engineer it to get a defensive point of view:
- Defensive Completed Air Yards Against = Vertical yards completed on a pass attempt at the moment the ball is caught in relation to the line of scrimmage against the defense.
- Average Intended Air Yards Against = Vertical yards intended on all pass attempts in relation to the line of scrimmage against the defense.
Very interesting results! Tampa Bay’s defense tops the ranks in the completed air yard category, while the Eagles have the top rank for intended air yards. The Pittsburgh Steelers rank 26th on the graph in completed air yards at 6.6 while ranking near the mean in the NFL with an 8.2 number for intended air yards, which ranks 18th so far in 2021. This highlights an observation from watching the games, in many cases the Steelers tend to play off coverage which would support the higher ranking in the intended air yards category. I also found it interesting to look at the Steelers upcoming 2021 opponents’ results: Chicago on the bottom left of the graph, Detroit ranking last in both data points, the Chargers and Cincinnati making the upper right on the graph, Minnesota with an above the mean completed air yards rank while offenses have higher intended air yards against them, Tennessee neighboring the Steelers on the graph, with Cleveland, Baltimore, and Kansas City near the mean in both categories.
What are your favorite takeaways from the results?
Now let’s look at quarterbacks with the following data points:
- Aggressiveness = Tracks the percentage of passing attempts a quarterback makes into tight coverage, where there is a defender within 1 yard or less of the receiver at the time of completion or incompletion.
- Completion % = Percentage of total passes that were caught
These results intrigued me, giving more context to quarterback play while also getting receiver separation context on the throws and decisions the quarterbacks have made so far in 2021. For example, Washington quarterback Taylor Heinicke ranks first in aggressiveness, but his below the mean completion percentage shows the negative side to the coin in comparison to Bengals quarterback Joe Burrow. Cardinals quarterback Kyler Murray leads the NFL in completion percentage with Dallas quarterback Dak Prescott a close second on more tight window throws. Steelers quarterback Ben Roethlisberger is above the mean in aggressiveness and just below the mean in completion percentage, highlighting the need for Roethlisberger and the receivers need to improve their connection as the season unfolds and the schedule gets tougher.
What are your favorite takeaways from the results?
Next, let’s look at running backs with the following data points:
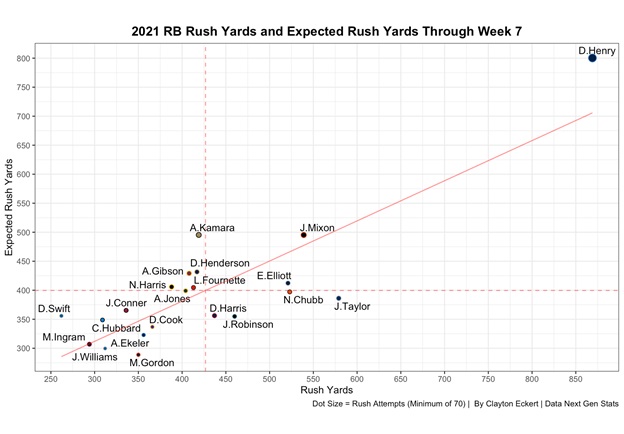
- Rush Yards
- Expected Rush Yards
- Rush Attempts
Titans running back Derrick Henry continues to “break” most graphs with the stellar year he is having in comparison to other running backs. Bengals running back Joe Mixon is second in attempts on the graph but with 68 less attempts than Henry. Steelers running back Najee Harris is above the mean in expected rush yards out of the running backs with the most attempts (>= 70) and is tied for sixth in attempts which is impressive considering the bye for the Steelers in week seven.
What are your favorite takeaways from the results?
Let’s look at wide receivers with the following datapoints:
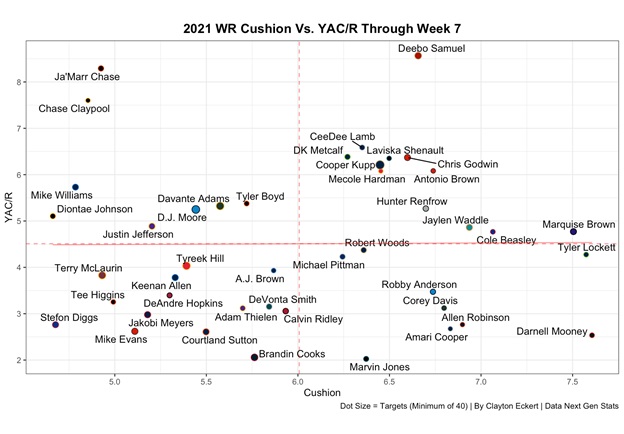
- Cushion = Distance (in yards) measured between a WR and the defender they’re lined up against at the time of snap on all targets
- YAC/R = Yards gained after the catch by the WR per reception
Looking at the YAC/R ranks we see 49ers wide receiver Deebo Samuel and Bengals wide receiver Ja’Marr Chase are the top two players in YAC/R followed by Steelers wide receiver Chase Claypool, highlighting his third overall rank out of receivers with a minimum of 40 targets! Claypool also has had to make most of his catches with little cushion along with Pittsburgh receiver Diontae Johnson having the least amount of cushion out of all the players on the graph. In my opinion, this highlights defenses playing the short pass game against Roethlisberger. It will be very interesting to see where these data point trend, especially in the next three games which many consider to be the most winnable games (Browns with possible key injuries, the Bears, and the Lions) on the Steelers tough remaining schedule.
What are your favorite takeaways from the results?
Thanks for reading and let me know your thoughts in the comments!


